14 Best Heatmap Tools Today
Are you looking to take your website’s user experience to the next level and drive measurable improvements in conversions? Heatmap tools offer a powerful solution for in-house testers and CRO agencies seeking to understand user behavior, identify friction points, and optimize website performance.
In this comprehensive guide, we’ll dive into the world of heatmap tools, exploring their features, benefits, and how they contribute to your user research efforts. We’ll compare the top heatmap tools on the market, helping you select the best solution for your specific needs and goals.
| Product | Starting (Billed Annually) |
Free Trial? |
Key Features | ||||||||||||||||||||
|---|---|---|---|---|---|---|---|---|---|---|---|---|---|---|---|---|---|---|---|---|---|---|---|
| Convert Experiences | $399/mo (or $299/mo billed annually) | Yes, 15-day free trial | Native heatmaps per experiment variation, per-variation comparison, Convert Signals® frustration detection, Signals-filtered session recordings | ||||||||||||||||||||
| Glassbox | Contact sales | No | Session replays, heatmaps and funnel analytics, integrated user struggle detection | ||||||||||||||||||||
| Quantum Metric | Contact sales | No | Advanced session replay, opportunity analysis, interactive heatmaps, user segmentation, frustration detection | ||||||||||||||||||||
| Instapage | $79/month | Yes, 14 days | Native A/B testing, heatmaps, AI content optimization, multi-page experience testing, real-time analytics | ||||||||||||||||||||
| Heatmap.com | $29/month (or $240/year, billed annually) | Yes, 14-day free trial | Revenue-based heatmaps, revenue-based scrollmaps, heatmapAI, split test and ad integrations | ||||||||||||||||||||
| Microsoft Clarity | Free | No | Session recordings, heatmaps, custom tagging, rage click detection, dead clicks analysis | ||||||||||||||||||||
| Mouseflow | $25/month | Yes, 14-day free trial + free plan | Session recordings with friction detection, interactive heatmaps, funnel analysis, behavioral segmentation | ||||||||||||||||||||
| Inspectlet | $33/month | No, but offers a free plan | Session recording with advanced filtering, dynamic heatmaps, form analytics | ||||||||||||||||||||
| VWO Insights | Contact sales | Yes, 30-day free trial | Dynamic heatmap analysis, advanced session recording, multi-device tracking | ||||||||||||||||||||
| Plerdy | $21/month | Yes, 14-day free trial + free plan | Advanced heatmap analytics, multi-device funnel analysis, real-time A/B testing, e-commerce analytics | ||||||||||||||||||||
| Lucky Orange | $32/month | Yes, 7-day free trial | Dynamic heatmaps, session recordings, form analytics, custom surveys, AI-powered discovery feature | ||||||||||||||||||||
| Crazy Egg | $29/month | Yes, 14 days | Heatmap visualization, comprehensive session recordings, segmented click analysis, error and conversion tracking | ||||||||||||||||||||
| FullStory | Contact sales | No | Session replay with search, frustration signal detection, custom funnel analysis, dynamic heatmaps | ||||||||||||||||||||
| Contentsquare | $39/month | No, but offers a free plan | Interactive heatmaps, session recordings, conversion funnels, voice of customer surveys |
Looking for an A/B testing solution to pair with your heatmap tool? Check out Convert’s A/B testing features with a free demo.
- Convert Experiences
- Glassbox
- Quantum Metric
- Instapage
- Heatmap.com
- Microsoft Clarity
- Mouseflow
- Inspectlet
- VWO Insights
- Plerdy
- Lucky Orange
- Crazy Egg
- FullStory
- Contentsquare
1. Convert Experiences
Best For: Conversion teams who want heatmaps and behavioral insights in the same platform they use to run experiments
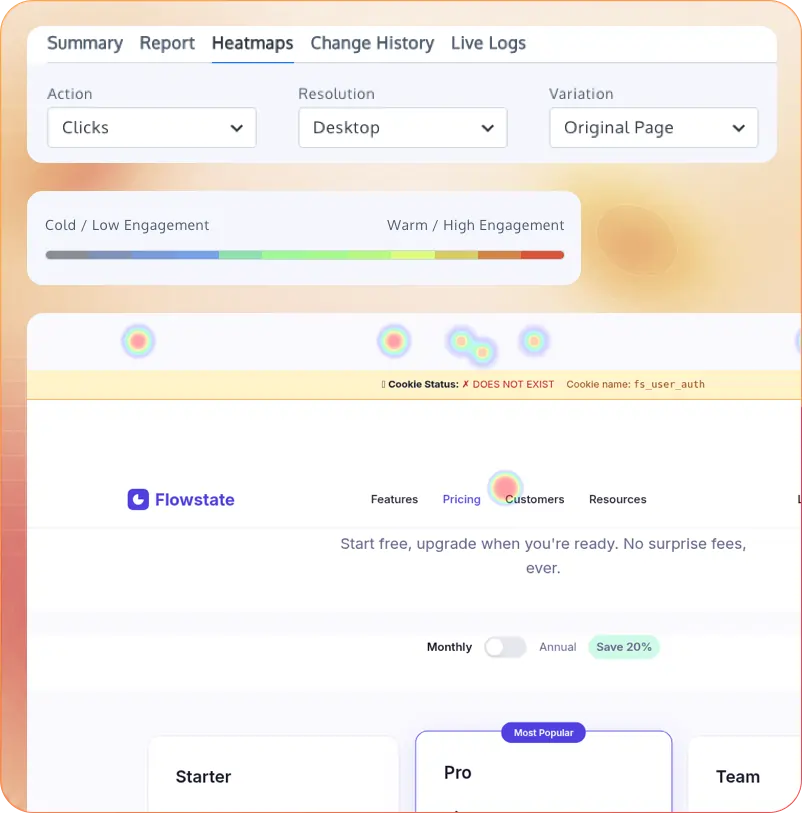
Convert’s native heatmaps show you where visitors click, tap, and scroll across every page and variation in your experiment. You can switch between click, move, and scroll views, filter by device and resolution, and compare your control against any variation directly from the Reports tab.
Convert also has a unique feature called Signals®, which is a frustration detection layer that sits alongside the heatmaps and flags the sessions worth digging into. It detects rage clicks, dead clicks, scroll stalls, hesitation patterns, API slowness, render delays, and more, then surfaces those sessions in recordings so you don’t have to manually comb through footage.
Key Features:
- Native heatmaps per experiment variation: See click, tap, scroll, and mouse movement data automatically generated for every variation in your test, filterable by device type and resolution.
- Per-variation comparison: Switch between your control and any variation directly from the Heatmaps tab to see how behavior shifts across treatments.
- Convert Signals® frustration detection: A patent-pending layer that automatically identifies rage clicks, dead clicks, scroll stalls, hesitation, and render delays across your pages.
- Signals-filtered session recordings: Session recordings are surfaced based on friction detected by Convert Signals®, so you’re reviewing the sessions most likely to reveal existing UX problems.
Pros:
- Insights and experimentation live in the same UI, so you can spot a friction pattern in a heatmap and launch a test to fix it without switching tools.
- All Visitor Insights features, including heatmaps and Convert Signals®, are included in your existing plan. You don’t have to pay any add-on fees or subscribe to a separate Insights tier to unlock them. Here’s how to enable it in your account.
- Convert doesn’t double-count users across its insights and testing features. In VWO, for example, a single visitor captured in a heatmap and then tested on consumes 2 MTUs from your quota. With Convert, that same visitor counts once.
Cons:
- Heatmap export isn’t available yet, and the current workaround is a manual screenshot.
- Heatmaps are only available for client-side experiments and deploys.
Pricing: Convert offers a 15-day free trial. Paid plans start at $399/month (or $299/month, billed annually) for up to 100K monthly tested users (MTUs).
2. Glassbox
Best For: Enterprise UX researchers testing complex conversion funnels
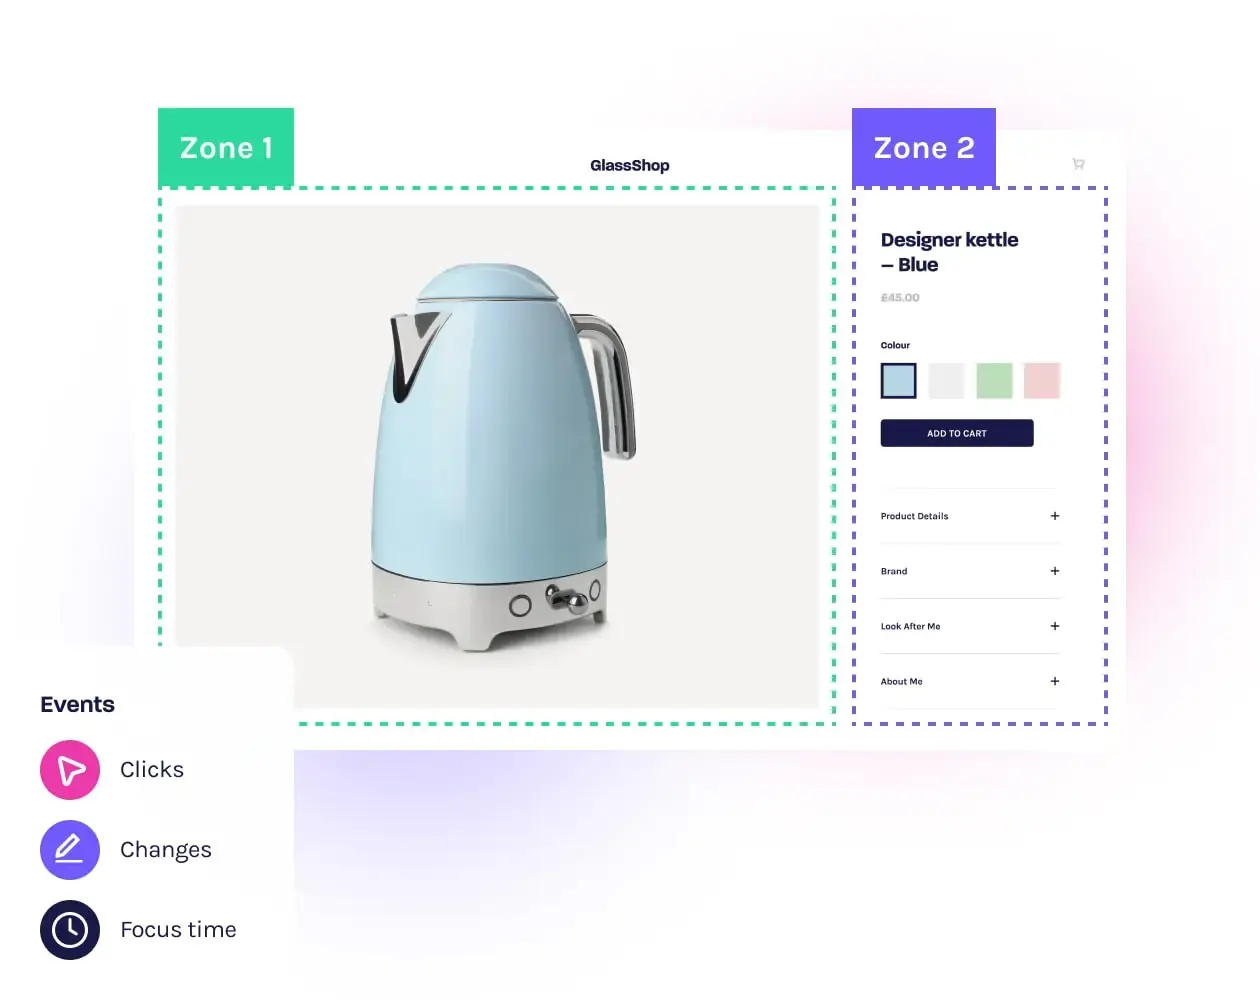
Glassbox automatically captures digital interactions without requiring manual tagging. You can create drag-and-drop funnels to analyze conversion paths in real time, while AI-powered insights highlight key opportunities and issues. The platform combines session replays, journey mapping, and technical performance data to help identify exactly why users abandon—from UI friction to backend errors.
Key Features:
- Advanced funnel analytics: Segments by multiple variables and integrate technical events with the drag-and-drop funnel builder.
- Comprehensive session replay: Captures both user interactions and technical events, with smart filtering and struggle flags that help teams quickly identify and resolve conversion blockers.
- Integrated struggle detection: Automatically identifies user friction points and technical errors, with impact quantification, enables teams to prioritize optimization efforts based on revenue impact.
Pros:
- Automatic capture of user sessions enables you to analyze every interaction without missing critical conversion data.
- AI-powered session analysis helps to quickly identify user struggles and optimization opportunities across large datasets.
- Seamless integration with CRM and VoC systems allows teams to connect customer feedback with user behavior data for more informed A/B test hypotheses.
Cons:
- System performance can be slow when analyzing large numbers of sessions.
- Session data is limited to one year of storage, restricting long-term trend analysis and year-over-year conversion comparisons.
- The bright, white-dominant interface can cause eye strain during extended analysis sessions.
Pricing: Contact Glassbox for a quote or to inquire about its free trial.
3. Quantum Metric
Best For: E-commerce teams detecting and resolving conversion-blocking technical issues
Quantum Metric helps you optimize digital experiences through real-time analytics AI-centered user insight summaries. Using its powerful Felix AI feature, teams can quickly summarize and review user insights from session replays and behavioral data without sifting through hundreds of sessions and views.
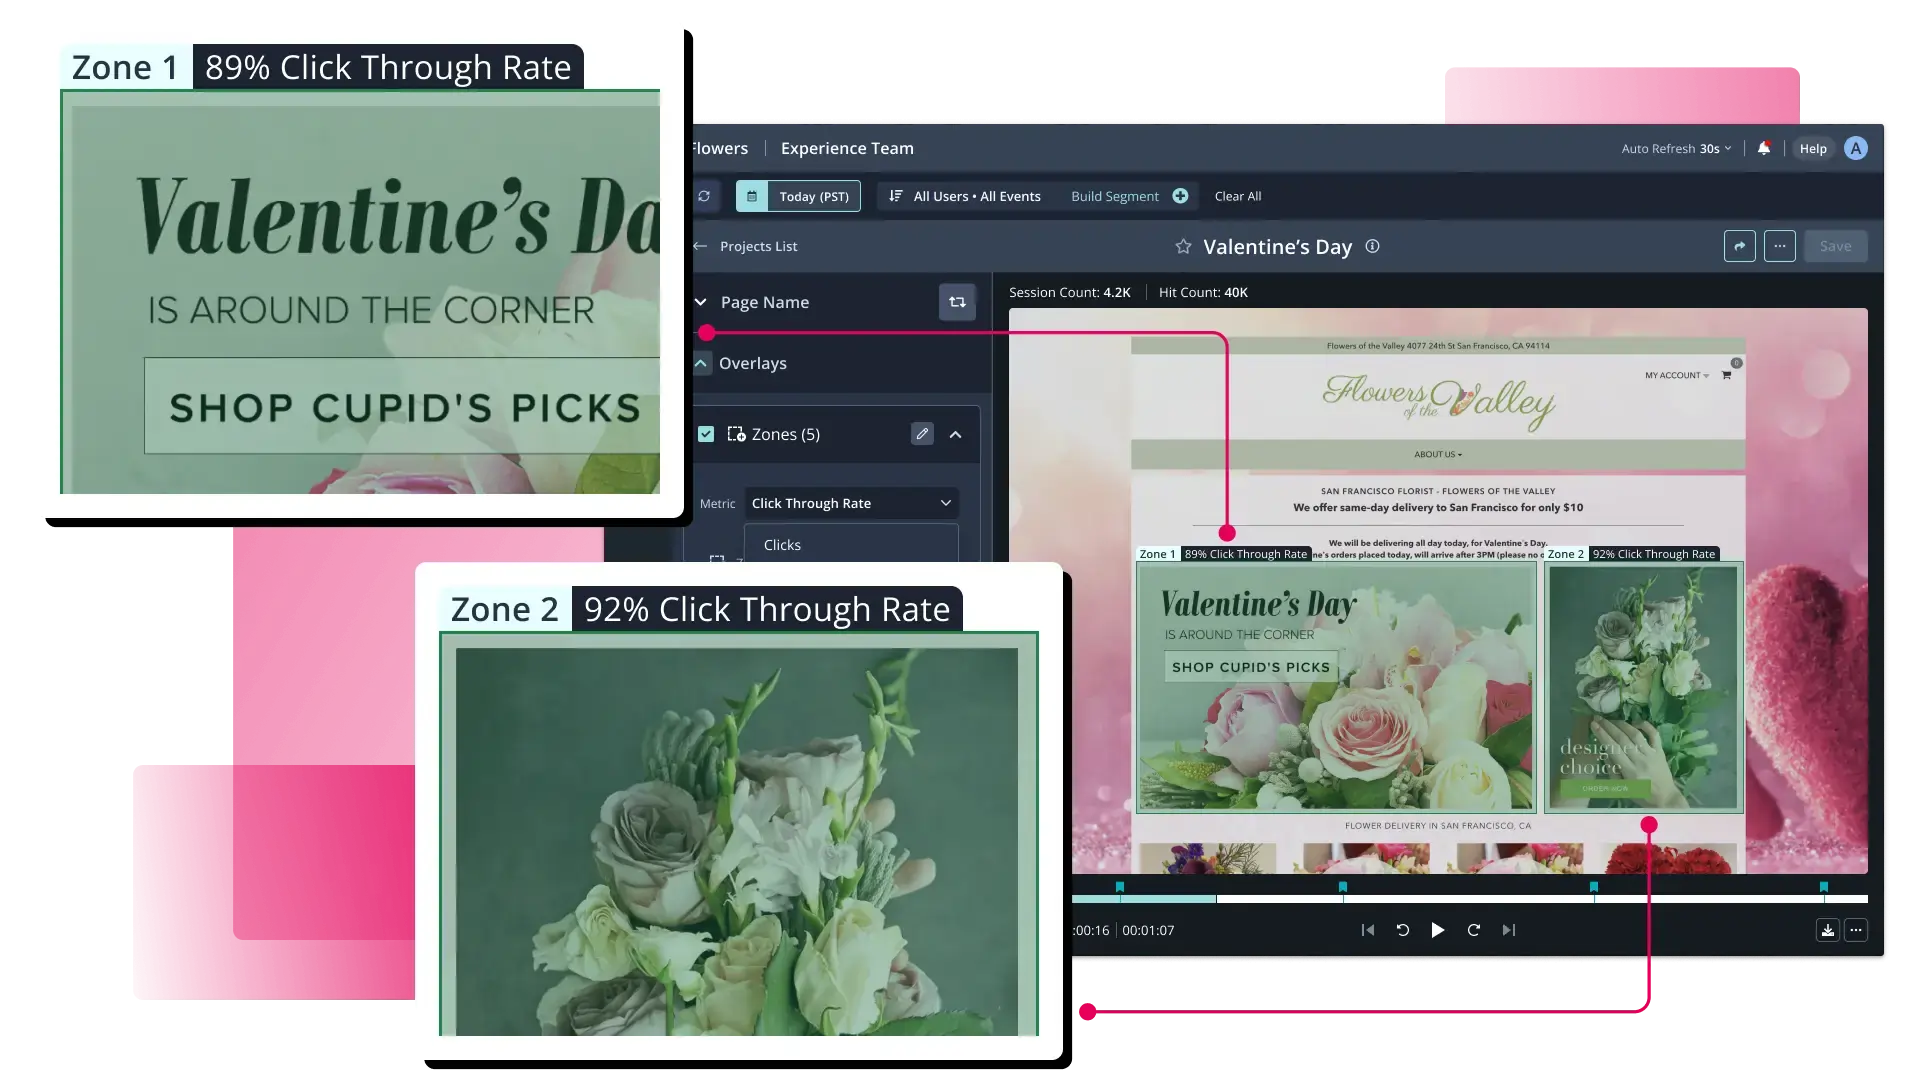
The platform automatically surfaces friction points and quantifies opportunities by capturing over 300 out-of-the-box metrics—including clicks, scrolls, and frustration signals like rage clicks. You can analyze conversion funnels, validate tests, and track behavioral patterns through interactive heatmaps that reveal exactly why and where customers struggle.
Key Features:
- Automated opportunity analysis: Surfaces friction points and quantifies their revenue impact across any conversion funnel.
- Interactive heatmaps with session integration: Visualize user engagement patterns while linking directly to corresponding user sessions.
- Intelligent segmentation builder: Sophisticated audience segmentation capabilities allow for detailed analysis of user behaviors and test results across multiple dimensions and nested conditions.
- Real-time frustration detection: Automatically identifies and quantifies user frustration signals like rage clicks, error messages, and repeated page loads to surface urgent optimization opportunities.
Pros:
- The platform’s comprehensive session replay and behavior tracking capabilities enable you to identify exact points of user friction and validate test hypotheses with real user data.
- Real-time analytics and conversion tracking features allow optimization experts to quickly measure the impact of A/B tests across multiple customer segments and combine statistical analysis with qualitative data for more comprehensive insights.
- The platform offers robust API integration capabilities.
Cons:
- The platform has a steep learning curve that requires significant time investment.
- The automatic event capture can produce complex data values.
- The platform’s extensive feature set can overwhelm stakeholders.
Pricing: Quantum Metric offers tailored packages and add-ons for different teams. Contact the team for a demo and custom quote.
4. Instapage
Best For: Post-click optimization specialists running multi-channel ad campaigns
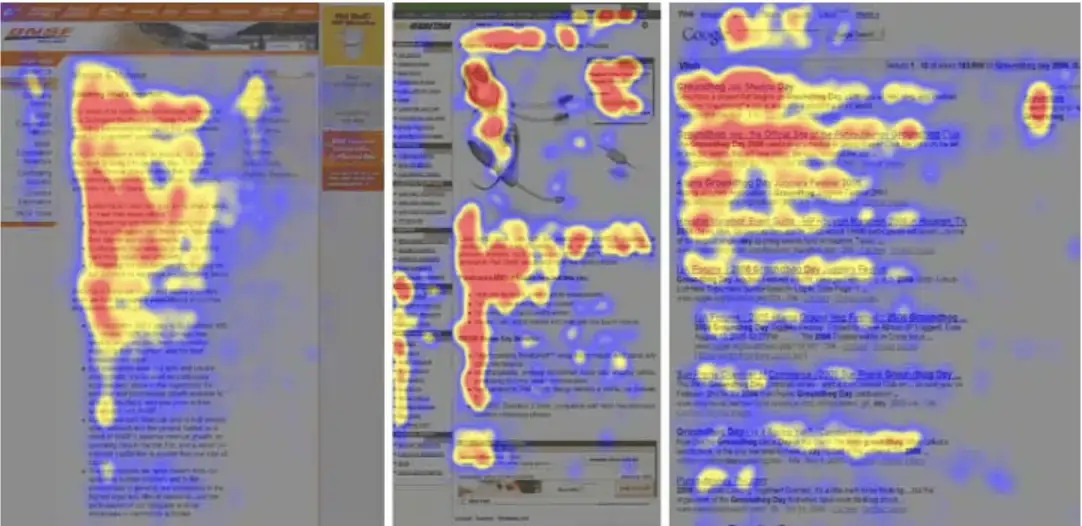
A popular landing page builder with a comprehensive feature set, Instapage not only helps you build landing pages at scale, but optimize them with its powerful A/B testing capabilities, analytics features, and personalization tools. The platform combines advanced analytics—including heatmaps and predictive insights—with an intuitive drag-and-drop builder to streamline your experimentation process: test variations, track user behavior patterns, and make data-driven improvements all in one place.
Key Features:
- Native A/B testing platform: Conduct experiments directly within the landing page builder.
- Heatmaps and behavior analytics: Track and display user interactions, clicks, and scroll patterns to identify areas of engagement and opportunities for optimization.
- Multi-page experience testing: Test different variations across multiple connected landing pages and user journey touchpoints.
- Real-time analytics dashboard: Get immediate insights into conversion metrics, traffic allocation, and experiment performance for data-driven decision making.
Pros:
- The AI-powered experimentation engine automatically directs traffic to better-performing variants.
- The advanced analytics dashboard provides comprehensive metrics including heatmaps, scroll depth, and predictive analytics.
- The platform offers server-side experimentation capabilities with seamless tech stack integration, allowing testing specialists to run sophisticated tests without technical limitations.
Cons:
- The pricing structure requires consultation with sales and can be significantly higher than competitors.
- The platform has a notable learning curve despite its user-friendly interface.
- Instapage analytics and optimization tools only apply to pages built on the platform, not the rest of your website.
Pricing: Instapage offers a 14-day free trial. Paid plans start at $79 per month for 15,000 unique monthly visitors when paid annually.
5. Heatmap.com
Best For: Ecommerce and DTC brands who want to increase their revenue per session, rather than clicks or raw traffic.
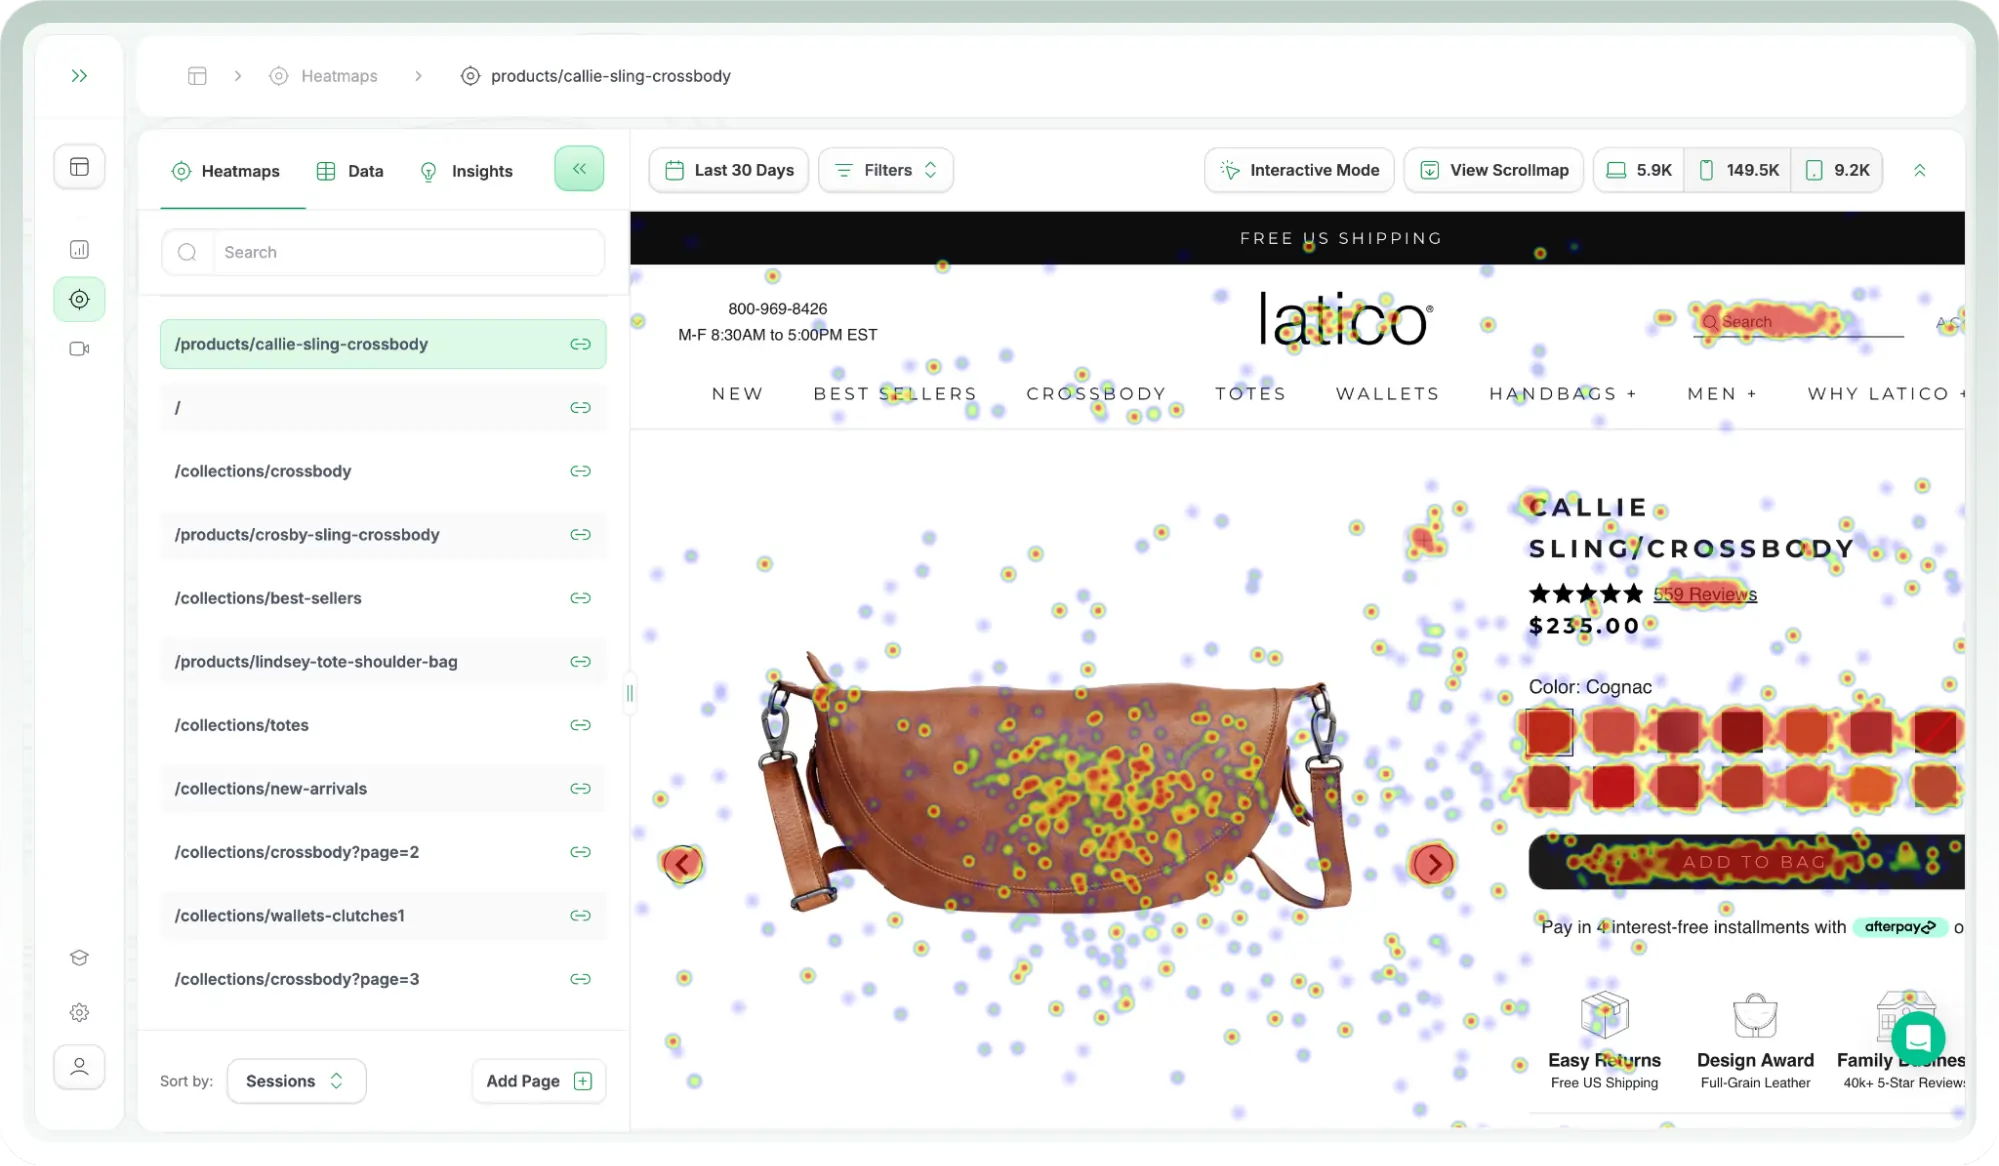
Heatmap.com is an ecommerce-focused tool that attributes revenue to every element on your page. Instead of showing you click density alone, it ties actual dollars to where people click and scroll, so you can see which buttons, sections, and product blocks are driving sales. Its north-star metric is Revenue Per Session (RPS), and the platform is designed around growing that number.
You get revenue-based heatmaps and scrollmaps, screen recordings, funnels, surveys, and web analytics in one place. You can segment the data by purchases, average order value, or traffic source, then move from an aggregate heatmap straight to the recordings of your highest-value buyers.
Key Features:
- Revenue-based heatmaps: See the revenue tied to every click on every element, with interactive mode for static and dynamic content and filters for purchases, AOV, and traffic source.
- Revenue-based scrollmaps: Track where revenue drops off down the page, so you know which underperforming sections to move up or rework.
- heatmapAI: Get AI-generated, revenue-focused recommendations for specific changes that increase RPS, built on CRO data from billions of data points.
- Split test and ad integrations: Connect native ad platforms (Meta, Google, TikTok, X) and split-testing tools (Intelligems, Visually, Shopify) to layer revenue data onto your experiments.
Pros:
- Revenue attribution on every element helps you optimize for buyer behavior instead of total traffic.
- It runs on any CMS (Shopify, WooCommerce, Webflow, custom builds) and installs in a couple of minutes via an 8kb asynchronous snippet. This keeps site speed intact, which is important for ecommerce stores where page speed directly affects conversions.
- It bundles heatmaps, scrollmaps, recordings, funnels, surveys, and analytics into one platform, so you’re not stitching tools together.
Cons:
- The ecommerce-only focus means it’s a poor fit for SaaS, lead gen, content sites, or anything where the conversion isn’t a purchase.
- Revenue tracking depends on correctly installing snippets on your site header and thank-you page, so a setup mistake can compromise the data the whole platform relies on.
- There’s no native A/B testing built in. You’ll need to integrate a separate split-testing tool to run experiments.
Pricing: Heatmap.com offers a 14-day free trial for its Behavioral Suite and Web Behavioral Suite+ plans. Paid plans start at $29/month (or $240/year, billed annually).
6. Microsoft Clarity
Best For: E-commerce optimization specialists with small sample sizes
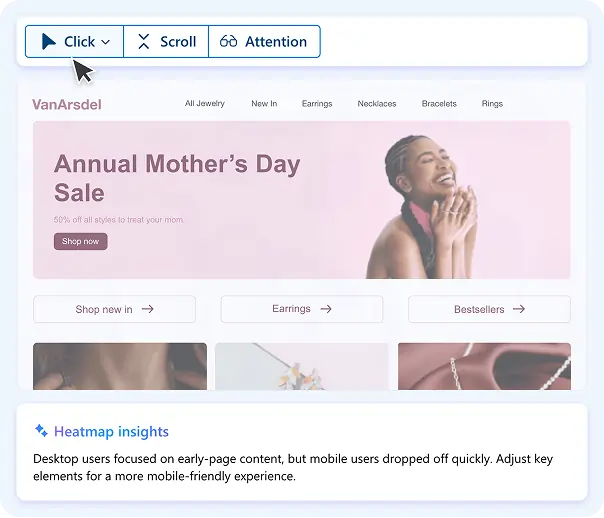
A qualitative user research product that helps you optimize conversion rates, Microsoft Clarity comes stacked with powerful, free behavioral analytics tools. You can visualize user behavior through heatmaps and session recordings while identifying friction points with metrics like rage clicks and dead clicks. Track unlimited traffic in real-time, integrate seamlessly with Google Analytics, and leverage advanced segmentation capabilities—all without impacting site performance.
Key Features:
- Session recordings: Watch real user interactions with your website to identify conversion blockers and understand exactly how visitors navigate through your conversion funnels.
- Interactive heatmaps: Visualize aggregate user behavior through click, scroll, and attention heatmaps.
- Custom tag tracking: Track specific user actions and segments by adding custom tags to analyze behavior patterns and conversion paths for different user groups.
- Dead clicks analysis: Discover where users are clicking on non-interactive elements, revealing opportunities to optimize your interface and improve conversion paths.
Pros:
- Free unlimited session recordings enable you to analyze user behavior at scale without budget constraints.
- AI-powered Copilot feature automatically summarizes multiple session recordings.
- Direct integration with Google Analytics allows seamless combination of quantitative data with qualitative insights.
- Microsoft Clarity integrates with Convert Experiences to create a full experimentation suite.
Cons:
- Limited suitability for websites handling sensitive data.
- Lack of built-in A/B testing capabilities requires integration with external tools like for testing implementation.
- Basic heatmap functionality offers fewer customization options compared to specialized CRO tools in the market.
Pricing: Microsoft Clarity offers a free forever plan.
7. Mouseflow
Best For: Website owners needing qualitative conversion insights to complement or inform split testing
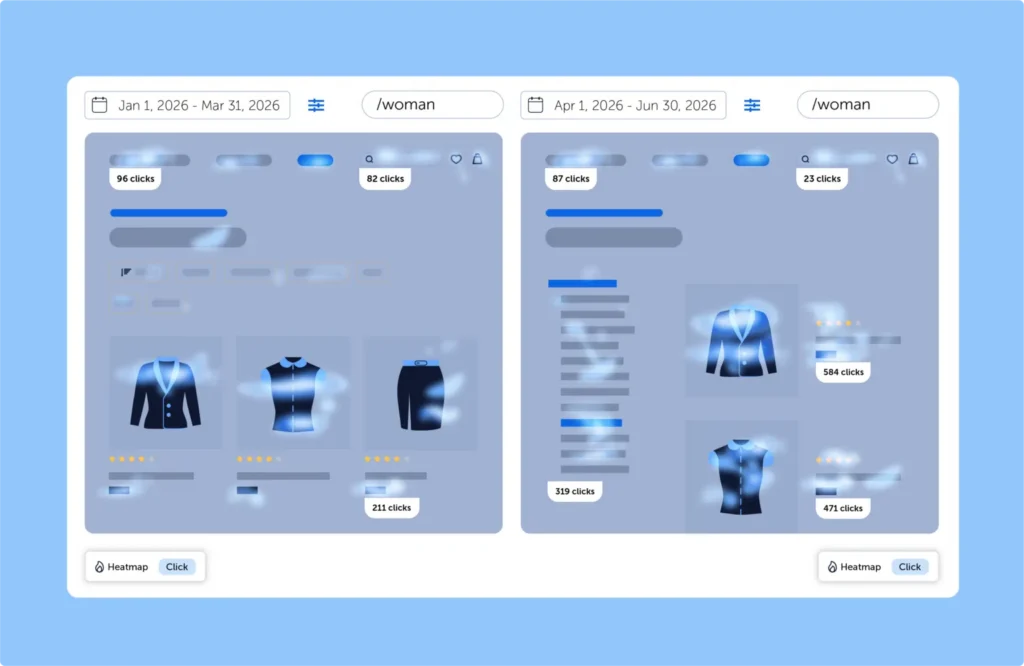
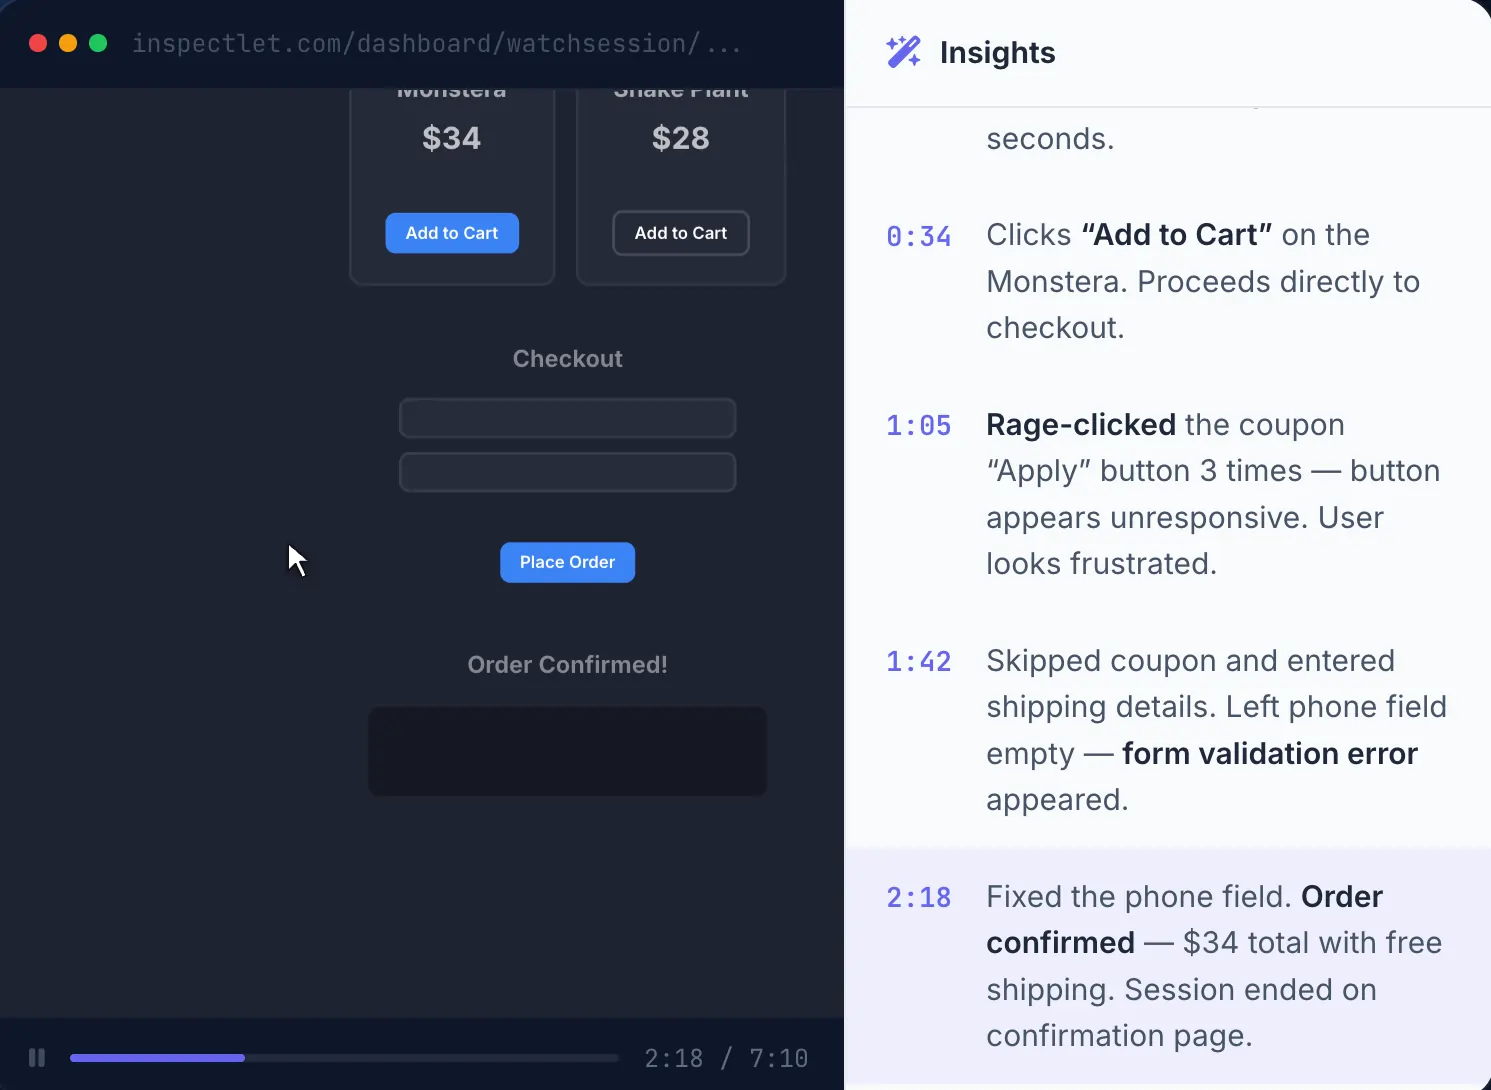
Mouseflow helps you uncover exactly why users abandon your site—and how to keep them from leaving. The platform combines session replay, heatmaps, and conversion funnels to show you where users drop off and why. You can watch real user recordings at each funnel stage, analyze form abandonment field-by-field, and measure the impact of your optimization efforts with up to 12 months of data.
Key Features:
- Session recordings with friction detection: Replay actual user sessions to identify pain points and optimize conversion paths, with AI-powered friction detection highlighting problematic interactions that impact conversion rates.
- Interactive heatmaps for A/B tests: Visualize user behavior across test variations with dynamic heatmaps showing clicks, moves, and scrolls.
- Behavioral segmentation and filtering: Analyze specific user segments and filter session recordings based on UTM parameters, traffic sources, and user behaviors.
Pros:
- The comprehensive session replay feature enables you to rewatch specific user segments and identify conversion bottlenecks in granular detail.
- The friction score functionality automatically detects frustrated user behavior patterns.
- The integrated form analytics tool reveals exactly where users abandon forms.
Cons:
- Session recording limits on lower-tier plans could restrict analysis for high-traffic websites, forcing you to upgrade or miss valuable user behavior data.
- The data retention period of only one to six months on starter plans may complicate long-term A/B testing analysis and year-over-year comparisons.
- Key features like Journey Analytics and the Friction Dashboard require higher-tier plans or add-ons.
Pricing: Mouseflow offers a 14-day free trial and a free plan for up to 500 monthly sessions. Paid plans start at $25 per month for 5,000 sessions, billed annually.
8. Inspectlet
Best For: Teams who want element-level click data and the flexibility to segment heatmaps by traffic source across dynamic, JavaScript-heavy sites.
Inspectlet’s dynamic heatmaps give you five ways to see how visitors interact with a page: eye-tracking, click density, click dots, scroll depth, and element-level click maps. The eye-tracking view maps mouse movement to show where attention lands, while the element map ranks exactly how many clicks each button, link, and CTA receives, so you can spot which ones get ignored.
You can segment any heatmap by traffic source to compare how visitors from organic search behave vs. those from social or email. And since the heatmaps render your actual page inside an iframe rather than a static screenshot, they work on SPAs, AJAX content, and anything loaded after the first paint.
Key Features:
- Dynamic heatmap analytics: Visualize user attention and interaction patterns through eye-tracking, click, and scroll heatmaps.
- Session recording with advanced filtering: Capture and analyze complete visitor interactions including mouse movements, clicks, and keypresses, with sophisticated filtering capabilities to find specific user segments and behaviors.
- User identification and event tagging: Connect specific users and events to session recordings through custom metadata and tagging.
Pros:
- Session recording captures every visitor interaction—including mouse movements, clicks, and scrolls.
- Advanced filtering and tagging capabilities allow A/B testing experts to segment and analyze specific user groups.
- Built-in compatibility with modern web technologies like AJAX and single-page applications ensures reliable data collection across complex websites.
Cons:
- Limited A/B testing functionality appears to be a secondary feature rather than a core offering.
- The platform focuses primarily on qualitative data through session replays and heatmaps, lacking robust quantitative analytics capabilities for comprehensive testing.
- Form analytics and error logging features, while present, lack advanced customization options.
Pricing: Inspectlet offers a free plan for up to 500K monthly sessions, 5,000 session replays, and one month of storage. Paid plans start at $33 per month with up to 1 million sessions, 10,000 session replays, and two months of storage when paid annually.
9. VWO Insights
Best For: UX researchers troubleshooting user friction points and drop-offs
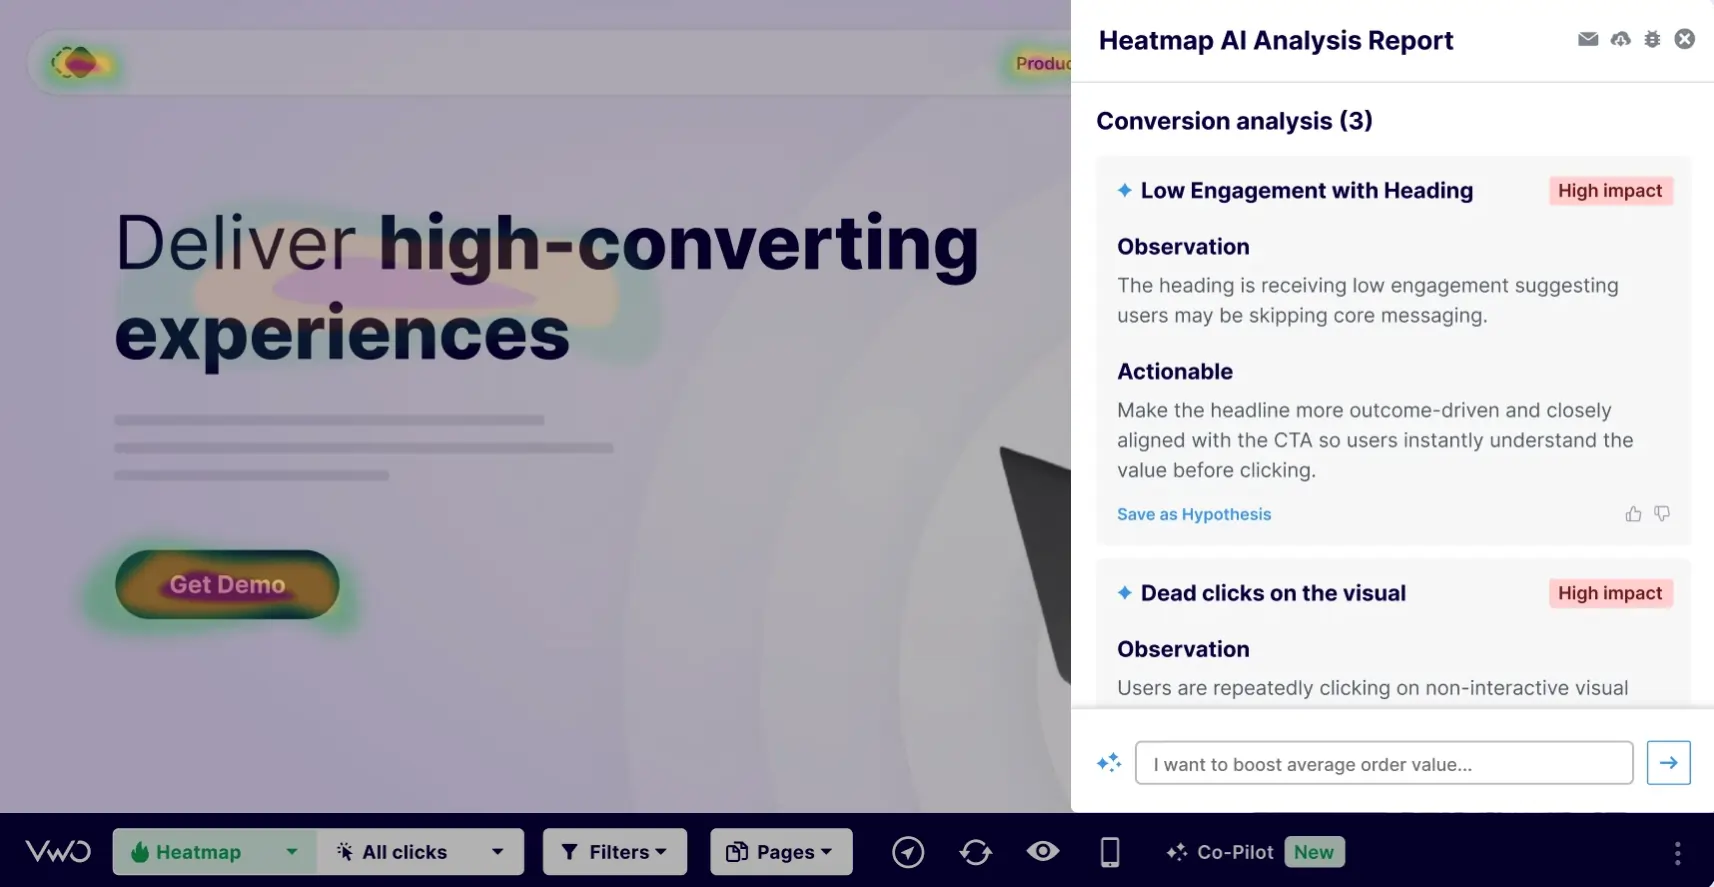
A well-known name in the industry, VWO Insights equips you with powerful behavior analytics through heatmaps, session recordings, and form analysis—all from a centralized hub. You can identify friction points and enhance website experiences with features like smart traffic sampling and unlimited filtering capabilities, while maintaining visitor privacy through built-in PII protection. Track multiple websites, integrate with your existing tools, and make data-driven UX decisions to boost conversion rates.
Key Features:
- Dynamic heatmap analysis: Provides comprehensive visualization of user interactions across all website elements, including dynamic content and pages behind login.
- Advanced session recording: Captures detailed user journeys with features like adjustable playback speed and event timelines.
- Multi-device behavior tracking: Seamlessly monitors user interactions across desktop, mobile, and tablet devices while maintaining visitor privacy.
Pros:
- Advanced session recording capabilities enable you to watch real user interactions and identify conversion barriers in granular detail.
- Comprehensive heatmap analytics help visualize exactly where visitors click, move, and scroll to validate test hypotheses.
- The integrated funnel analysis tool allows you to track visitor paths and quickly identify major dropout points that need optimization.
Cons:
- VWO Insights may require data sampling to manage quotas.
- The free plan lacks customizable goals and funnels as well as A/B test variation heatmaps.
Pricing: VWO offers a 30-day free trial. There are three pricing plans but you have to contact the team for a quote depending on your needs.
10. Plerdy
Best For: E-commerce optimization specialists running multiple online stores
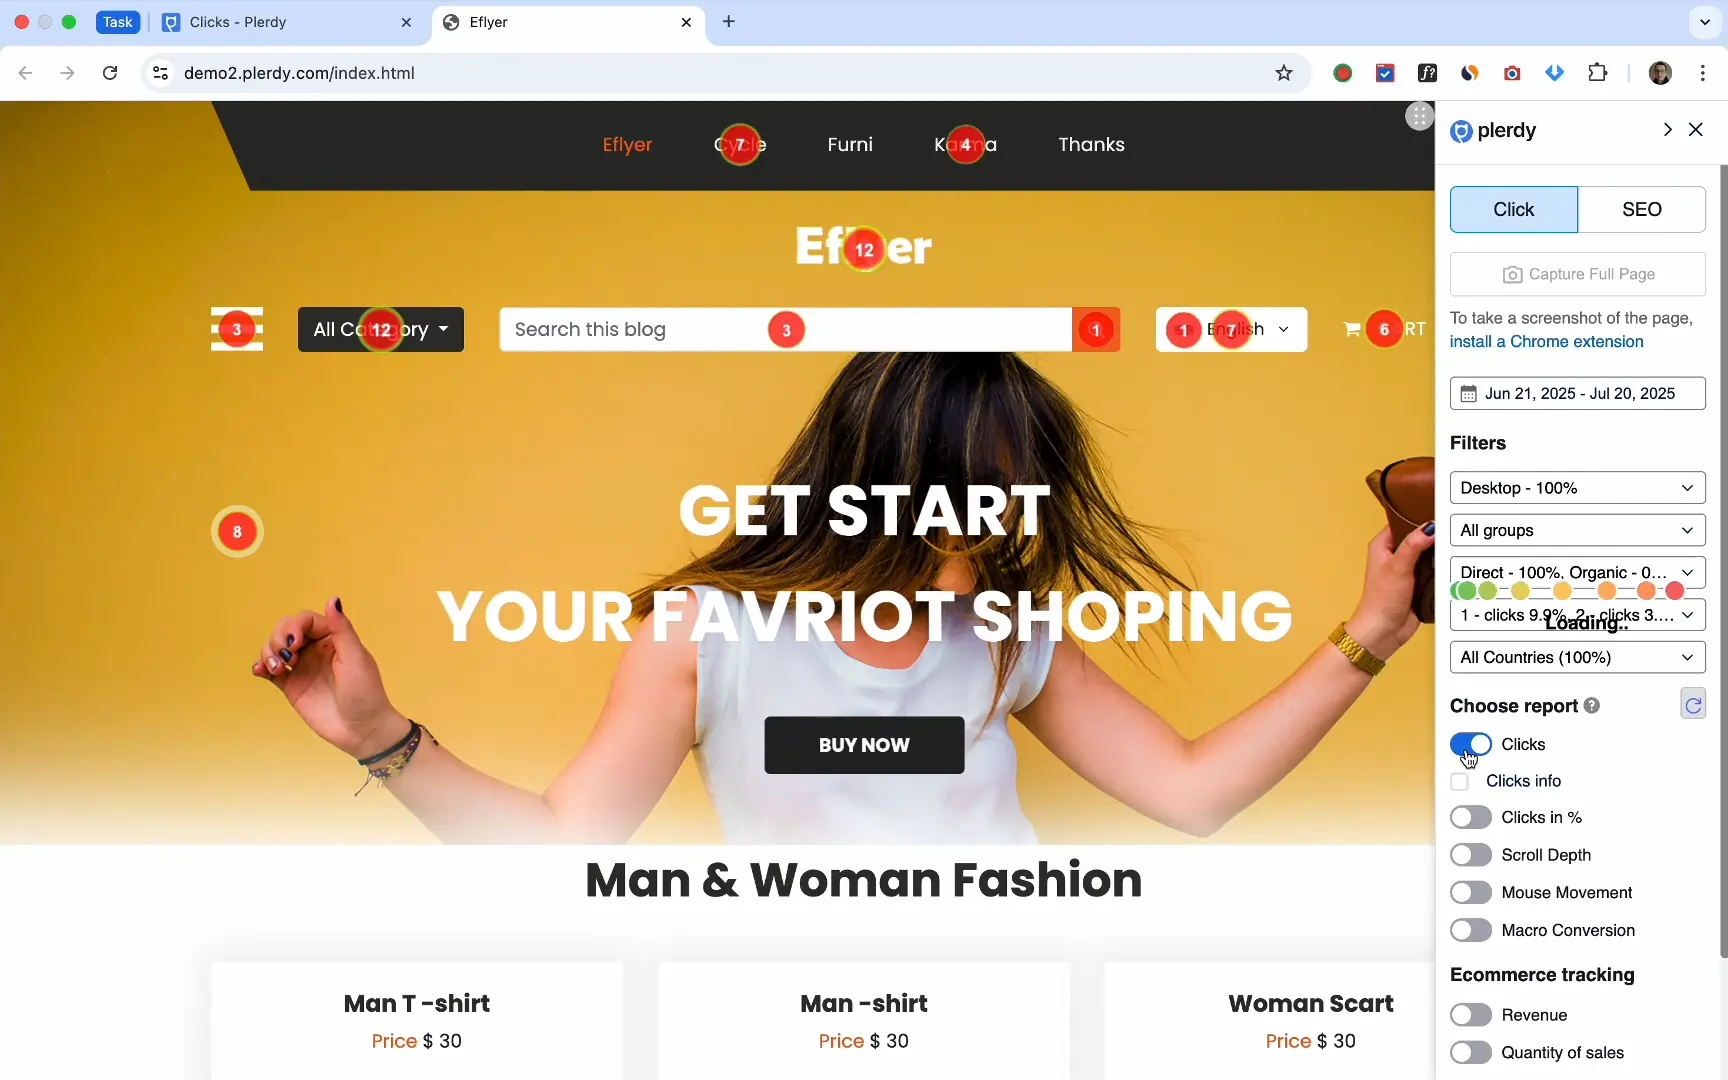
Plerdy combines essential conversion optimization tools—including heatmaps, session recordings, and A/B testing—into a comprehensive platform that helps you uncover exactly why visitors aren’t converting. You can track user behavior with detailed heatmaps, analyze drop-off points through funnel analysis, and validate optimization decisions with A/B testing: all while maintaining minimal impact on site performance with zero server load.
Key Features:
- Advanced heatmap analytics: Provides comprehensive visualization of user behavior through click maps, scroll depth tracking, and mouse movement analysis.
- Profit-driven element analysis: Monitor and measure the direct profit generation of specific website elements, helping you identify which components are most effective at driving conversions and calculate the ROI of different page sections.
- Real-time A/B testing tool: Offers seamless creation and monitoring of page variants with device-specific targeting and instant performance metrics.
Pros:
- Plerdy offers unlimited A/B testing capabilities even in its free plan.
- The platform combines A/B testing with comprehensive heatmaps, e-commerce tracking, and session recordings.
- Advanced targeting options let you segment tests by device type, country, and traffic source.
Cons:
- Storage limitations restrict access to historical data to just one, three, or six months depending on plan level.
- The platform requires separate packages for each web domain.
Pricing: Plerdy offers a 14-day free trial and a free plan with up to 100 heatmaps (daily limit) and 500 video sessions. Paid plans start at $21 per month for up to 500 heatmaps (daily limit) when paid annually.
11. Lucky Orange
Best For: E-commerce optimization specialists diagnosing product page friction
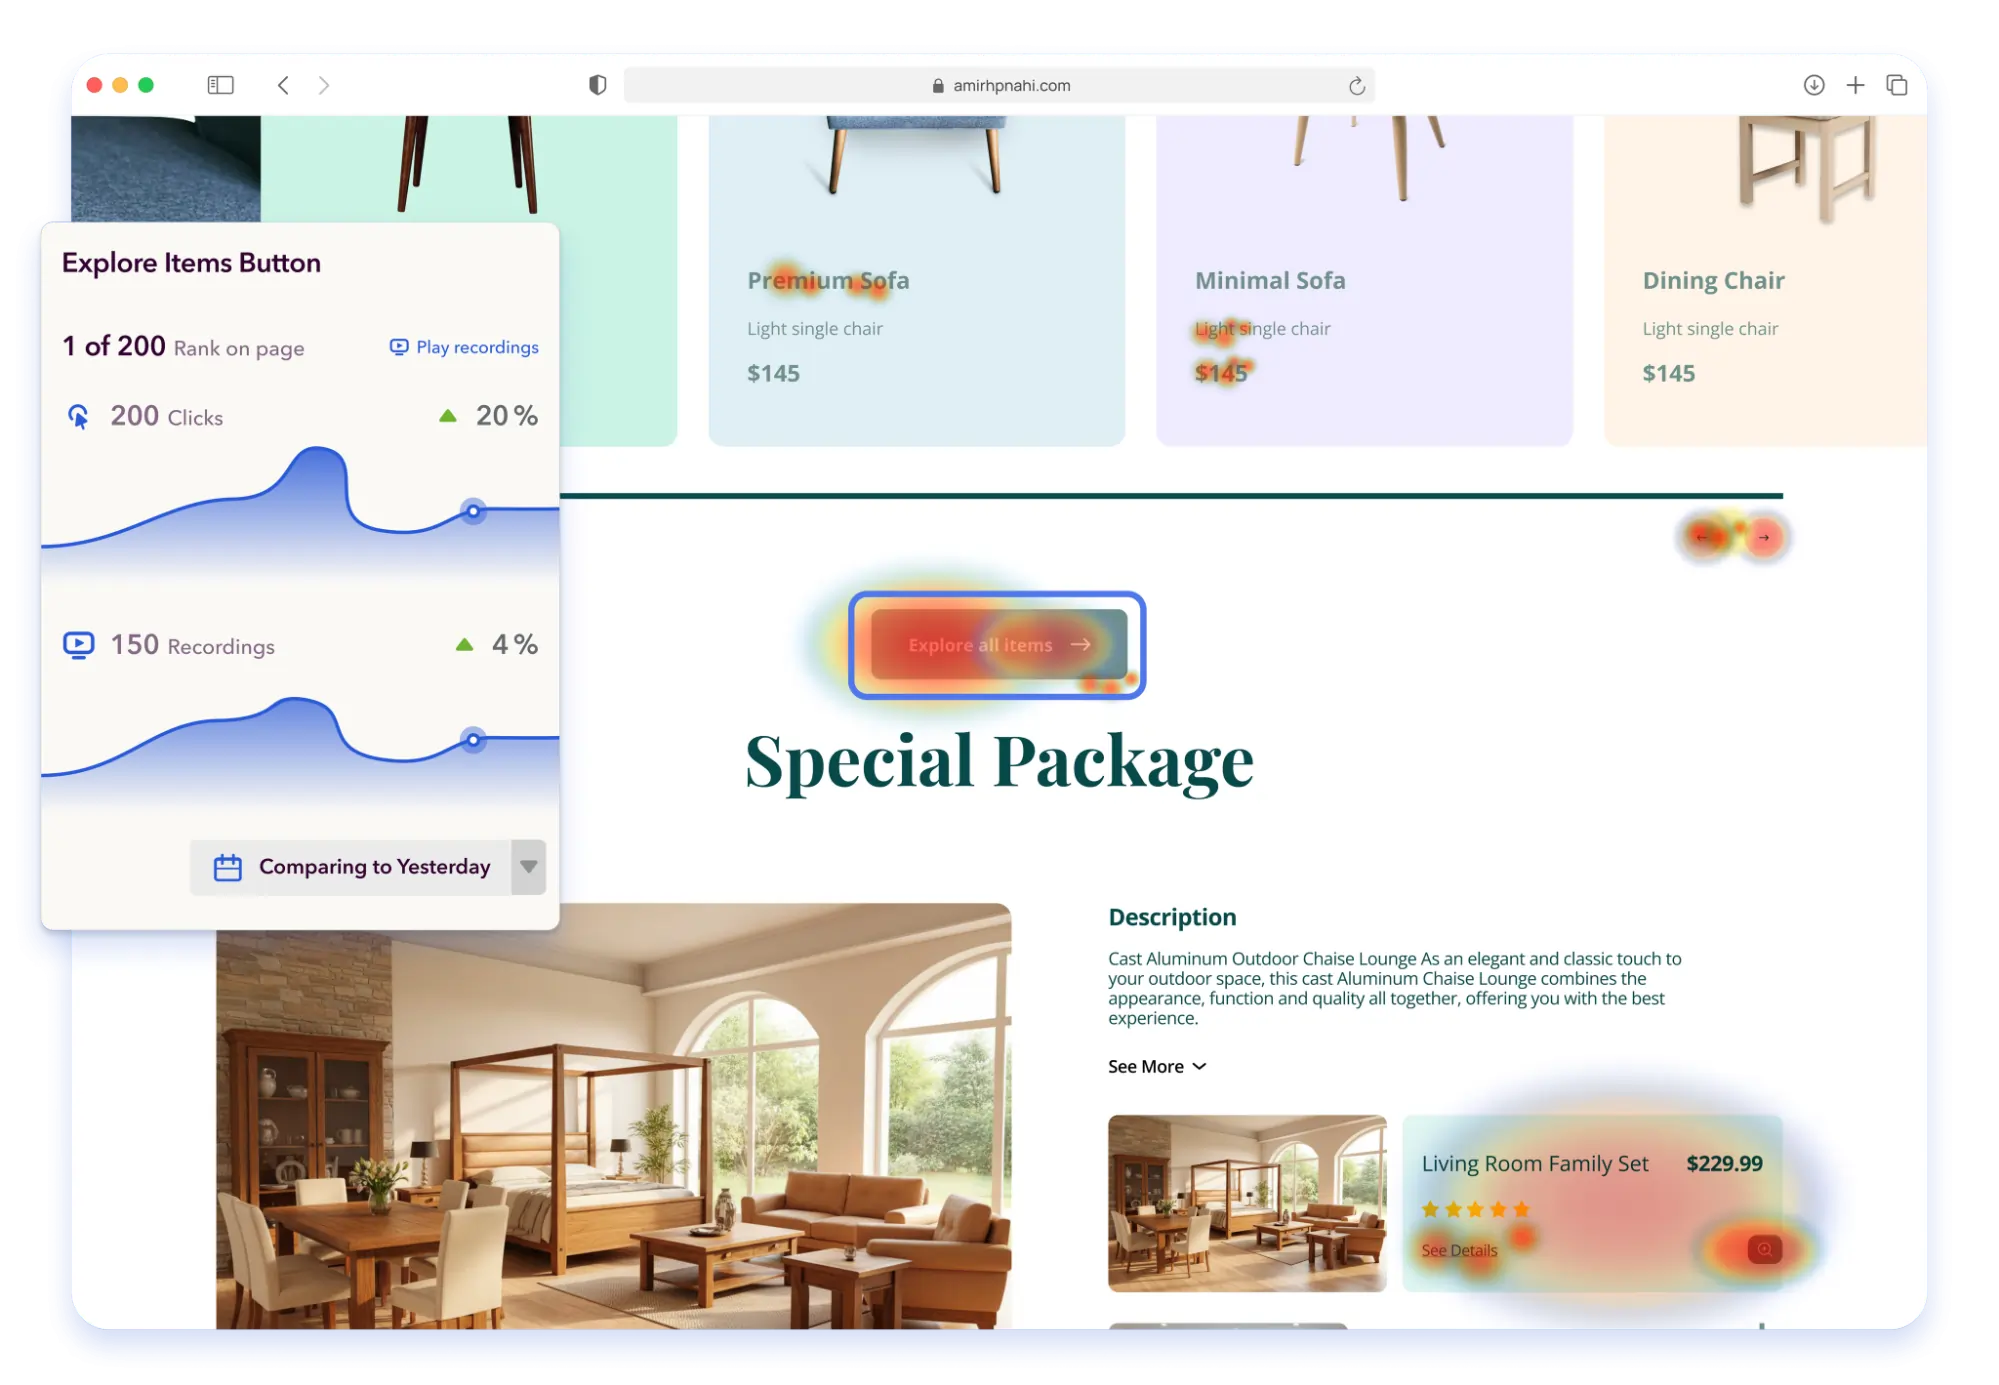
Need to uncover conversion roadblocks? Lucky Orange’s dynamic heatmaps and session recordings reveal exactly how visitors interact with your site. You can watch real visitor behavior, identify friction points, and collect targeted feedback through customizable surveys—all while maintaining GDPR compliance and visitor privacy. The platform’s new Discovery feature automatically surfaces valuable optimization opportunities, directing you straight to actionable insights that drive measurable conversion improvements.
Key Features:
- Dynamic heatmaps: Visualize user behavior patterns across your website with real-time heat mapping that shows exactly where visitors click, move, and scroll.
- Form analytics: Track form completion rates, abandonment points, and field hesitation times.
- Custom surveys: Gather direct feedback from visitors at critical moments in their journey with targeted surveys.
- Lucky Orange Discovery: Automatically identify high-value optimization opportunities through AI-powered analysis of user behavior patterns.
Pros:
- Lucky Orange’s session recordings capture every click and interaction.
- The dynamic heatmaps feature reveals behavior trends and scroll depth patterns.
Cons:
- The platform’s live viewing function becomes unreliable with high visitor volumes.
- The learning curve can be steep without dedicated account management support.
Pricing: Lucky Orange offers a 7-day free trial. Paid plans start at $32 per month for up to 3,500 monthly sessions when paid annually.
12. Crazy Egg
Best For: Small e-commerce teams optimizing product purchase flows
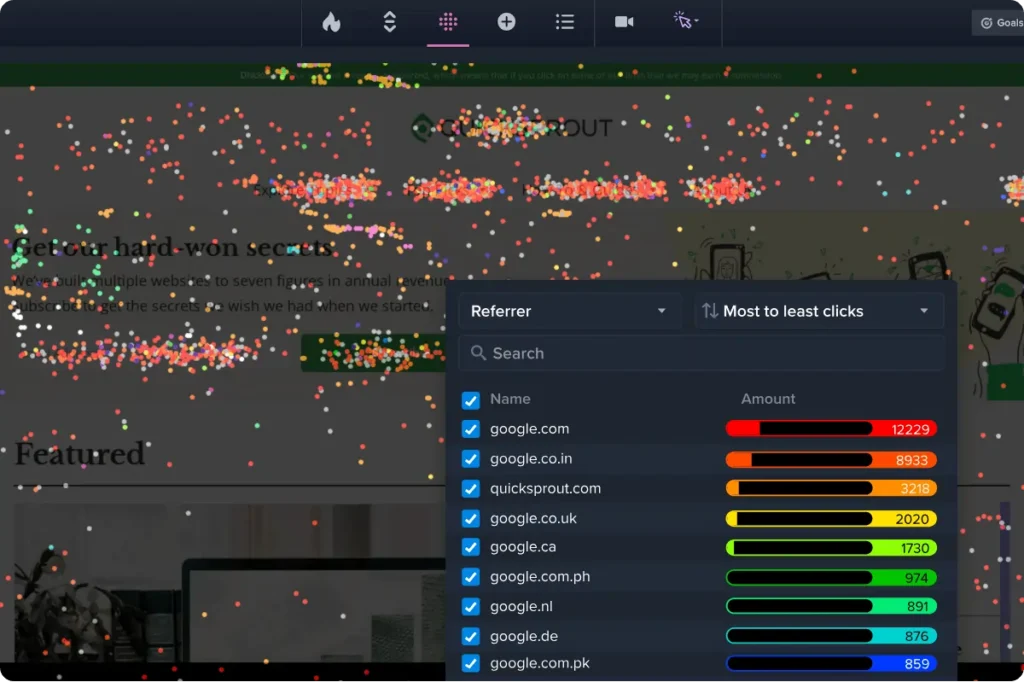
Crazy Egg helps you transform your website’s performance with powerful visualization and testing tools. You can track visitor behavior through heatmaps and session recordings, then validate your optimization decisions with built-in A/B testing capabilities. The platform’s comprehensive suite includes error tracking, conversion analysis, and traffic source monitoring—giving you everything needed to identify opportunities and fix conversion blockers.
Key Features:
- Advanced heatmap visualization: Reveals exactly where visitors focus their attention through color-coded maps.
- Session recordings: Captures full user sessions with mouse movements and interactions.
- Segmented click analysis (Confetti Report): Breaks down visitor clicks into 18 distinct categories including traffic sources and user types.
Pros:
- Comprehensive visual analytics through heatmaps and session recordings enable you to quickly identify user behavior patterns and optimization opportunities.
- Integrated A/B testing functionality with tools like Convert allows for immediate implementation and validation of optimization hypotheses based on behavioral insights.
- Built-in error tracking and real-time customer feedback collection help optimization specialists identify and fix conversion bottlenecks faster.
Cons:
- Manual event tracking process requires additional setup time and technical knowledge.
- Session sampling approach may limit access to complete user behavior data.
- Implementation can impact page load speed more noticeably than competitors.
Pricing: Crazy Egg offers a 14-day free trial. Paid plans start at $29 per month for up to 5 heatmap reports per month.
13. FullStory
Best For: Multi-page funnel testers and product managers diagnosing user experience frustrations
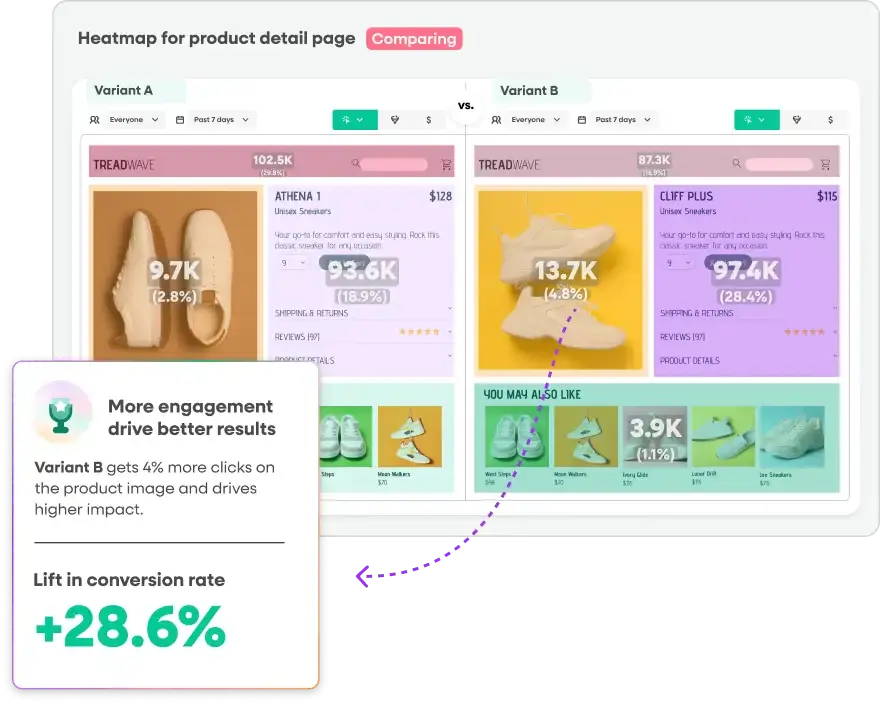
FullStory is a powerful user behavior platform that collects qualitative session data and transforms it into actionable insights through its comprehensive digital experience platform and custom funnel analysis views. You can validate conversion paths and identify friction points with precision using session replay, heatmaps, and automatic detection of user frustration signals. FullStory’s no-code analytics tools help quantify revenue impact while enabling real-time monitoring of KPIs through collaborative dashboards.
Key Features:
- Session replay with advanced search: Find and watch any user session instantly using powerful search capabilities across events, user attributes, and behaviors.
- Custom funnel analysis: Build and analyze conversion funnels with the ability to segment users, track drop-offs, and instantly replay sessions of users who abandoned at any step.
- Dynamic heatmaps: Visualize aggregate user behavior through scroll maps and click maps that automatically capture all user interactions without requiring manual tagging or setup.
Pros:
- Session replay with AI-powered summaries enables you to quickly identify user friction points and form data-backed test hypotheses.
- Automated behavior capture requires no manual tagging.
Cons:
- Manual session review process can be time-consuming.
- Requires combination with separate A/B testing tools.
- Privacy masking features may limit visibility into form field interactions.
Pricing: Contact FullStory for a custom quote.
14. Contentsquare
Best For: Scrappy marketing and product teams validating design changes with qualitative data
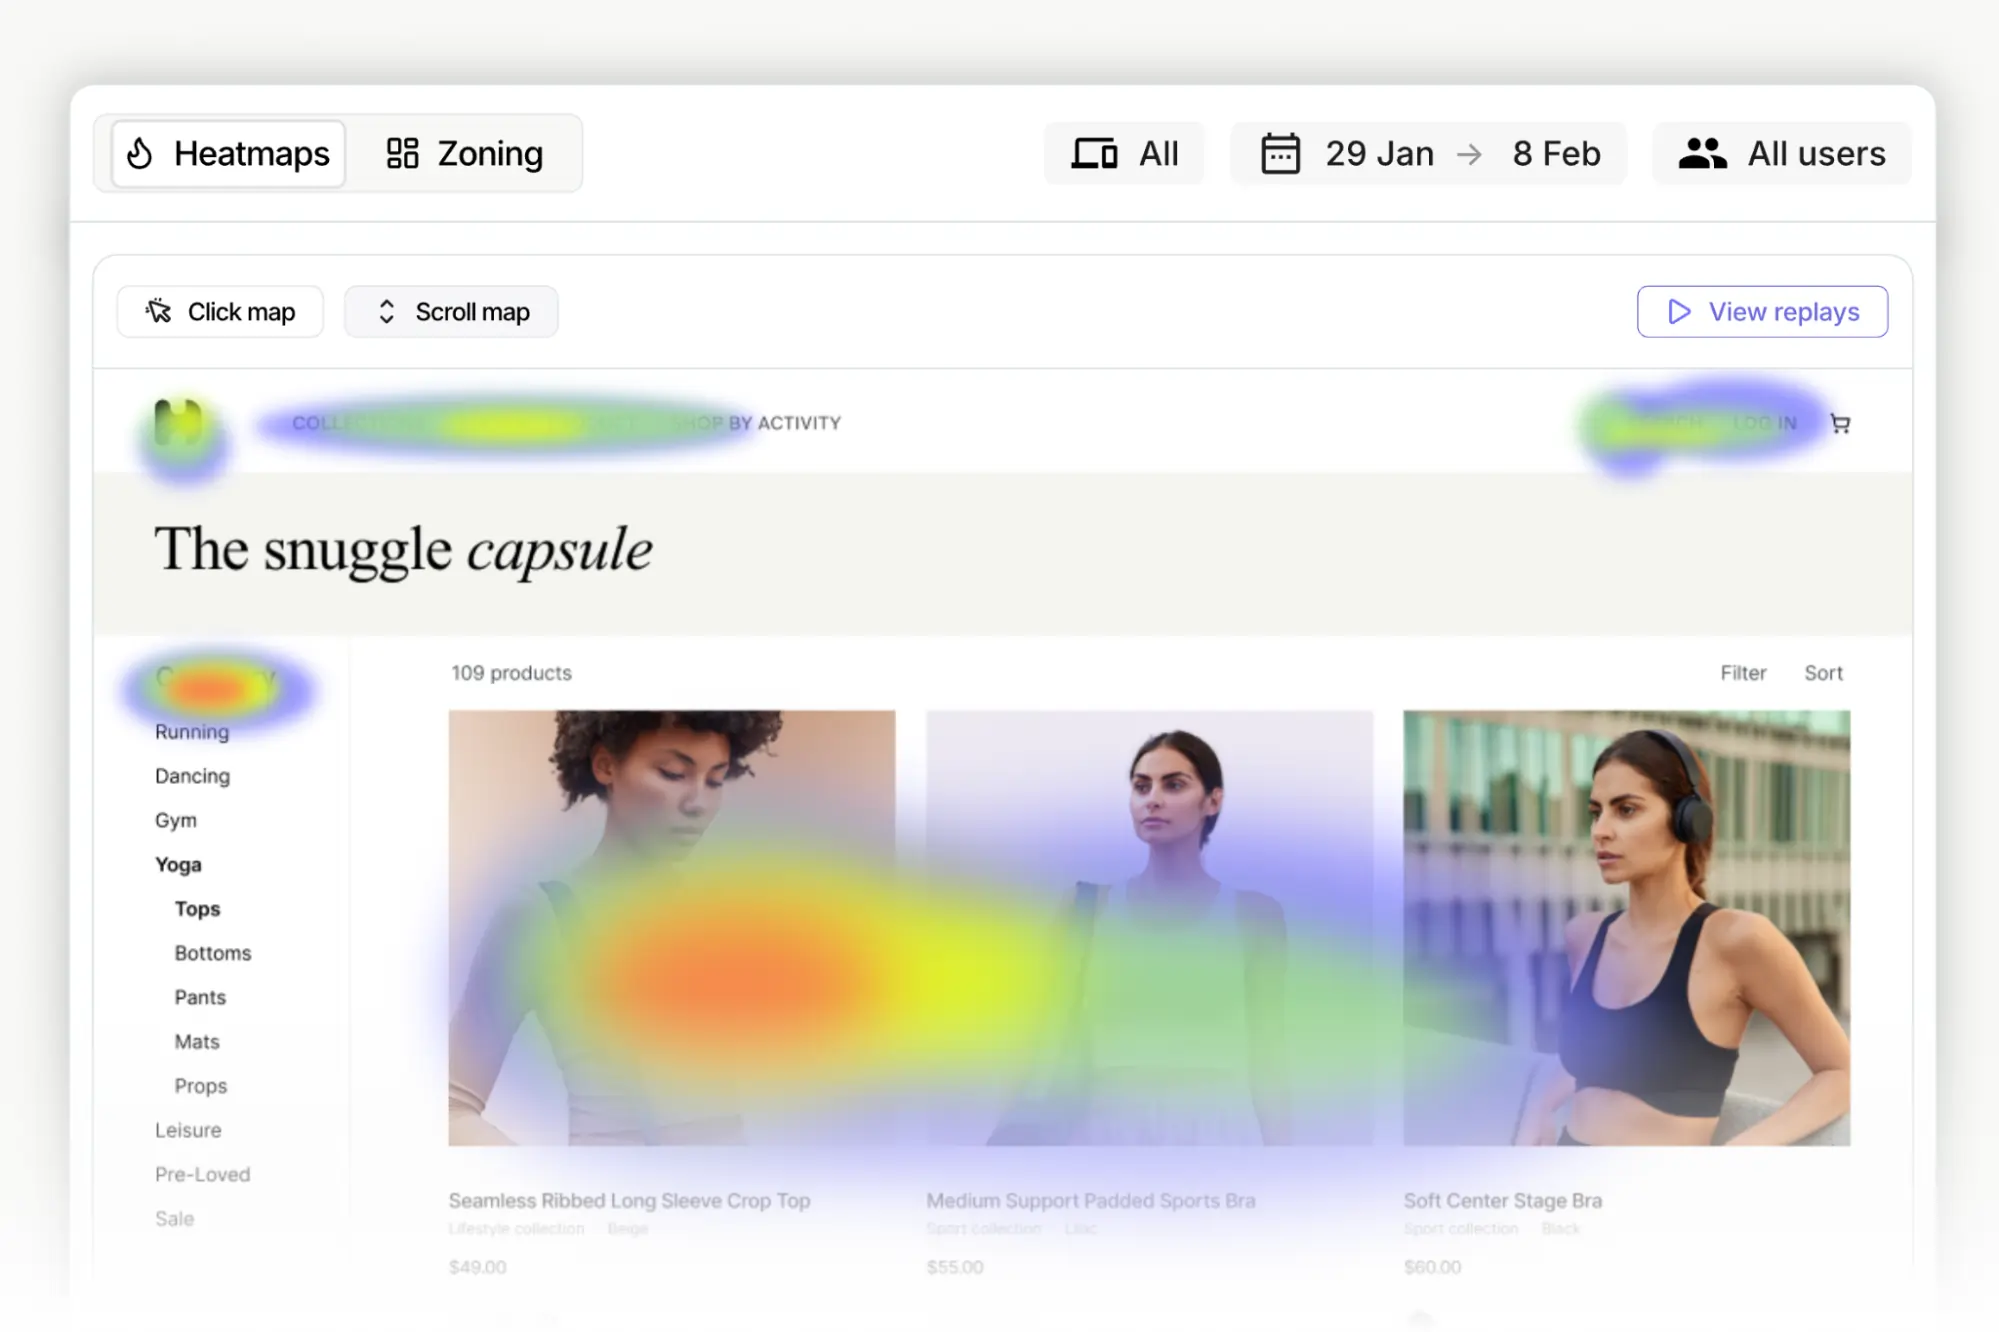
As of July 2025, Hotjar, the comprehensive suite of customer feedback and user behavior tools, officially integrated with its parent company, Contentsquare Group. So all the familiar features you associate with Hotjar (like heatmaps, recordings/session replay, and surveys) now live inside the Contentsquare platform.
In Contentsquare, you can visualize exactly how users interact with your site through heatmaps and session recordings while collecting real-time feedback to understand their motivations.
This comprehensive toolset helps you identify conversion bottlenecks, validate A/B test hypotheses, and optimize the user experience based on actual visitor behavior rather than assumptions. You can also integrate with testing platforms like Convert to run post-hoc test analyses on individual user segments and identify potential UX changes with new variants.
Key Features:
- Interactive heatmaps: Reveals exactly where users click, move, and scroll on your pages.
- Conversion funnels: Visualize how users move through your conversion paths, highlighting drop-off points and opportunities for optimization.
- Voice of Customer surveys: Gather qualitative data from users about their experience, helping validate A/B test hypotheses and uncover optimization opportunities.
Pros:
- Heatmaps provide comprehensive visualization of user behavior patterns.
- Session recordings with rage click detection help A/B testing specialists pinpoint specific user frustrations and validate test hypotheses.
- Integrates with A/B testing tools like Convert to augment qualitative data with quantitative insights.
Cons:
- Hotjar can negatively impact website loading speed.
- Limited form analytics capabilities restrict deeper analysis of form abandonment patterns crucial for conversion optimization.
- Higher-tier plans required for advanced features can be costly for teams running extensive testing programs.
Pricing: Contentsquare offers a free forever plan for up to 200K monthly sessions. Paid plans start at $39 per month when paid annually.
When evaluating heatmap tools, consider these key criteria to ensure you choose a solution that aligns with your testing goals and empowers your team.
1. Feature Set
Look for tools that offer a wide range of heatmap types, including click, scroll, and mouse movement maps, to gain comprehensive insights into user behavior. Prioritize solutions with intuitive interfaces and easy-to-interpret visualizations, enabling your team to quickly identify trends and make data-driven decisions.
2. Scalability
Scalability is another crucial factor, especially for larger organizations or those with ambitious testing roadmaps. Opt for heatmap tools that can handle high traffic volumes and offer seamless integration with your existing tech stack, such as A/B testing platforms and analytics tools. This will streamline your workflow and provide a holistic view of your website’s performance.
3. Support and Resources
Finally, consider the level of support and resources provided by the heatmap tool vendor. Look for companies that offer robust documentation, training materials, and responsive customer support to ensure your team can effectively leverage the tool’s capabilities and troubleshoot any issues that arise.
Picking the right heatmap tool comes down to a few key considerations. Here’s what to think through before you commit.
- Define your objectives first
To choose the right heatmap tool for your organization, start by clearly defining your testing objectives and the specific insights you hope to gain.
Also, determine which types of heatmaps are most relevant to your goals, and prioritize tools that excel in those areas. For example, if you’re primarily interested in understanding how users navigate your site, a scroll map may be more valuable than a click map.
- Evaluate usability and data presentation
Next, assess the user-friendliness of each tool’s interface and visualizations. The best heatmap tools present data in a clear, accessible format that enables stakeholders across your organization to easily interpret and act upon the insights.
Consider conducting a trial or demo of each tool to assess its ease of use and determine whether it aligns with your team’s workflow.
- Check for integrations and support
Assess the level of integration and support offered by each heatmap tool. Prioritize solutions that seamlessly integrate with your existing tech stack and offer robust support resources to ensure a smooth implementation and ongoing success.
Conclusion
Heatmap tools are essential for modern conversion optimization, offering unprecedented visibility into user behavior patterns and friction points that impact your bottom line. Each heatmap tool and platform brings unique strengths to the table—from Glassbox’s enterprise-grade funnel analytics to Microsoft Clarity’s accessible yet powerful free toolkit.
When selecting a heatmap solution for your optimization program, focus on tools that align with your specific testing methodology and scalability needs. Consider factors like integration capabilities with your existing testing stack, data retention policies that support your analysis timeframes, and whether features like AI-powered insights can accelerate your optimization workflow.
That said, if you’d rather not use a separate tool for behavioral data and another for experimentation, Convert is worth a close look. Its native heatmaps and Signals® frustration detection feature live in the same platform you use to build and run your tests. So, when you spot friction in a heatmap, you can turn it into a hypothesis and launch an experiment right there, without exporting data or switching tools.
For teams that want their insights and their experiments under one roof, that’s a hard combination to beat. Want to see how it works? Sign up for a free trial today.
What is Heatmapping Software?
Heatmapping software is an indispensable part of a marketer’s toolkit that helps you visualize user behavior on websites or applications, providing insights into how users interact with your digital properties.
These tools capture data points such as clicks, mouse movements, and scrolling behavior, and overlay this information onto a visual representation of your website. This allows you to quickly identify trends, uncover usability issues, and make data-driven optimizations to improve the user experience and drive conversions.
How Do Heatmap Tools Work?
Heatmap tools collect user interaction data by tracking mouse movements, clicks, taps, and scrolling behavior. JavaScript code is added to the site, which records this data for each visitor. The tool then aggregates the data and overlays it onto the webpage as a color-coded visualization. Warmer colors like red indicate high interaction, while cooler colors like blue show less activity. By analyzing these patterns, CRO professionals can infer user attention, interest, and friction points.
What Are the Different Types of Heatmaps?
There are several types of heatmaps, each offering unique insights into user behavior:
- Click maps: These heatmaps show where users click on your website, helping you identify the most engaging elements and potential usability issues.
- Scroll maps: Scroll maps visualize how far users scroll down your pages, revealing which content is most engaging and where users tend to drop off.
- Mouse movement maps: These heatmaps track mouse movement, providing insights into how users navigate your site and which elements capture their attention.
- Eye-tracking heatmaps: Using specialized hardware, eye-tracking heatmaps show where users focus their attention, offering granular insights into user engagement.
How Do Heatmaps Improve User Research?
Heatmaps offer several key benefits for user research:
- Identifying usability issues: By visualizing user behavior, heatmaps can quickly uncover navigational challenges, confusing layouts, or unclear calls-to-action.
- Validating design decisions: Heatmaps provide quantitative evidence to support or refute design choices, helping teams make data-driven decisions.
- Revealing engagement patterns: By showing how users interact with your site, heatmaps can help you optimize content placement, improve information architecture, and create more engaging experiences.
Ultimately, heatmaps complement other user research methods, such as user testing and analytics, to provide a comprehensive understanding of user behavior and drive meaningful improvements to your website’s performance.
What Are the Benefits of Using Heatmap Tools for CRO?
Heatmap tools offer several key benefits for conversion rate optimization:
- Visualize actual user behavior: Heatmaps show how real users interact with your site, rather than relying on guesswork or assumptions. This objective data validates or challenges hypotheses about user behavior.
- Identify opportunities for improvement: By revealing where users focus attention and encounter friction, heatmaps highlight areas ripe for optimization. This allows faster iteration and more targeted A/B tests.
- Streamline analysis: Heatmaps provide an at-a-glance understanding of complex user behavior data. This visual format makes it easier to communicate findings and get stakeholder buy-in.
- Complement other analytics: Heatmaps add a qualitative dimension to quantitative metrics like bounce rate and conversion rate. Together, these paint a more comprehensive picture of the user experience.
- Test and validate changes: Heatmaps can be used before and after implementing changes to confirm the desired effect on user behavior. This closed-loop insight validates that optimizations are working.
How Can Heatmap Data Be Used to Improve Website Conversion Rates?
Heatmap insights can drive conversion improvements across the entire funnel:
- Optimize content placement: Ensure key content and CTAs are placed where users expect and engage. Move important elements into high attention areas and remove distracting clutter.
- Streamline user flow: Identify and remove friction points like excessive scrolling, erratic mouse movements, or unintended clicks that derail the conversion path. Guide users more linearly toward conversion.
- Personalize experiences: Use segmented heatmaps to tailor page layouts and content to different user types. Personalized variations matched to user intent can boost conversion rates.
- Prioritize A/B tests: Heatmaps reveal high-impact elements worth A/B testing, so you can iterate faster. Focus testing where it matters most for conversions.
- Benchmark behavior changes: Compare heatmaps before and after CRO changes to prove impact. Verify key content is getting more attention and interaction as intended.


Mobile reading?
Written By
Alex Birkett, Althea Storm
Written By
Alex Birkett, Althea Storm


Althea Storm
Althea Storm is a B2B SaaS writer who’s worked with top companies like HubSpot, Thinkific, and Zapier to create content that informs and converts. She has a knack for making complex tech feel simple, useful, and genuinely engaging. When she’s not writing about software, she’s either reading fiction or working on some of her own.