CRO KPIs that Actually Matter: What to Track and How to Report
What are CRO KPIs?
CRO KPIs are the most important numbers you track to measure whether changes to your website are improving business results.
For example, if you change a product page, simplify a form, test a new headline, or redesign your checkout, you need a way to tell whether that change actually helped. Did more people buy? Did more qualified leads come through? Did more visitors book a demo? CRO KPIs help you answer those questions.
A good CRO KPI should do three things:
- First, it should be clearly tied to a business goal.
- Second, it should be actionable, meaning a team can respond to it and improve it.
- Third, it should be specific enough to show whether a test, page change, or funnel improvement is working.
CRO metrics vs CRO KPIs
Not every metric is a KPI. You can track lots of numbers on a website, including bounce rate, scroll depth, clicks, pageviews, form starts, and add-to-carts. But a KPI is different. A KPI is a metric that helps you align your CRO goals to business goals.
If your goal is to increase revenue, your KPI might be purchase conversion rate, revenue per visitor, or average order value. If your goal is to generate better leads, your KPI might be qualified lead rate rather than just total form submissions. If your goal is to improve SaaS growth, you might track trial signup rate, activation rate, or trial-to-paid conversion.
| CRO metrics | CRO KPIs |
|---|---|
| Any numbers you track to understand what visitors are doing on your site | The few numbers you track to judge whether your site is improving a business goal |
| They help you spot behavior, such as where people click, where they drop off, or whether they start a form | They help you measure outcomes, such as whether more people buy, book a demo, or become qualified leads |
| Examples: scroll depth, CTA clicks, form starts, add-to-cart rate | Examples: purchase conversion rate, revenue per visitor, qualified lead rate, demo booking rate |
| Useful for diagnosing problems | Useful for judging whether a page change, test, or redesign actually worked |
11 CRO KPIs that actually matter
KPIs that measure revenue and conversions
These are the KPIs closest to the result most teams actually care about: more sales, more qualified signups, more demo bookings, or more revenue from the traffic they already have.
1. Conversion rate
Conversion rate is the percentage of visitors who complete the main action you want them to take, such as making a purchase, submitting a form, booking a demo, or starting a trial.
It’s often the first KPI teams look at because it’s one of the clearest ways to measure whether a page, funnel step, or test is performing better.
Here’s how to calculate the conversion rate:
Conversion rate = conversions ÷ total visitors × 100
For example, if 5,000 people visit a page and 150 of them complete the main action, your conversion rate is 3%.
Where to get it:
You can use GA4 to find your conversion numbers.
In GA4, use:
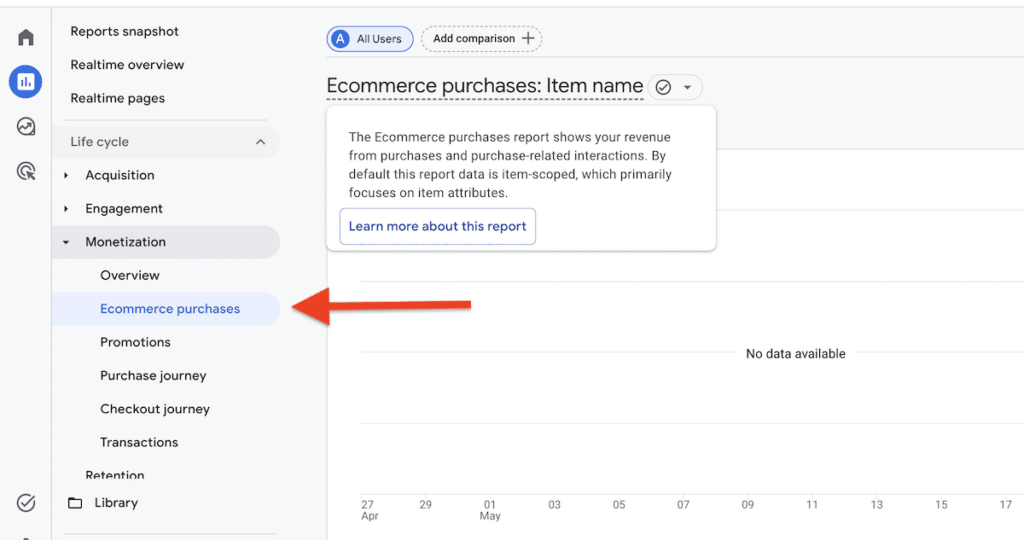
- Reports → Monetization → Ecommerce purchases if the conversion is a purchase
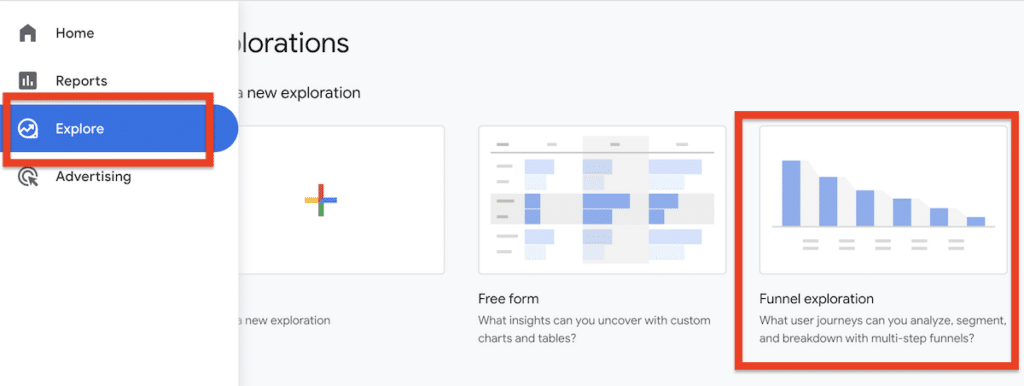
- Explore → Funnel exploration if you want to measure how many people moved from one step to the next and completed the final action
- Reports → Engagement → Events if you want to check how many times a form submit, signup, demo request, or other tracked action happened. Then compare that number with your page visitors or users for the same period. Google’s GA4 help describes engagement reporting and event-based measurement as the basis for this kind of analysis.
2. Revenue per visitor
Revenue per visitor shows how much revenue your site generates, on average, from each visitor. It is useful because it tells you whether your site is making more money from the traffic it already gets, not just whether more people are converting.
Formula: Revenue per visitor = total revenue ÷ total visitors
For example, if your site generates $12,000 in revenue from 4,000 visitors, your revenue per visitor is $3.
Where to find it:
In GA4, go to Reports → Monetization → Ecommerce purchases to get your revenue number.
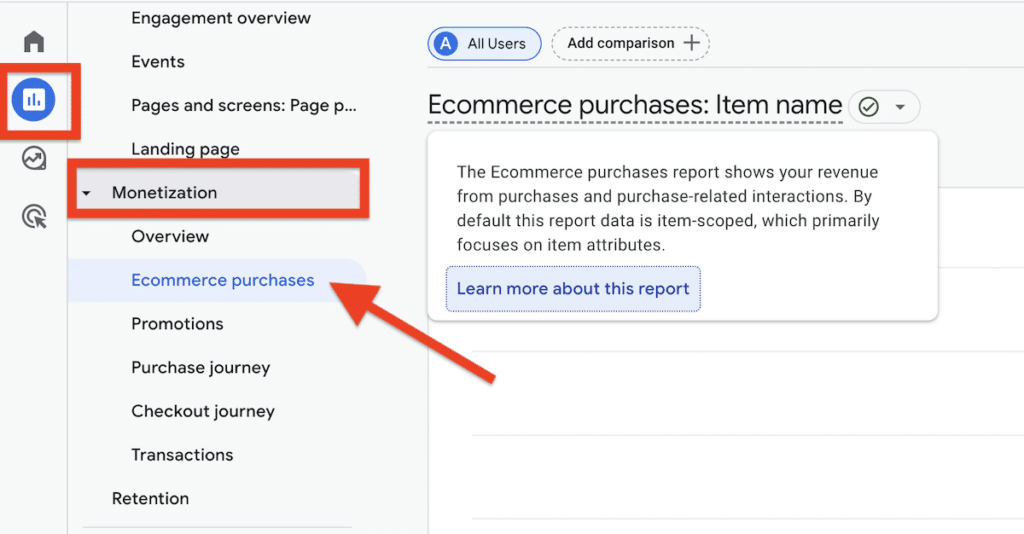
Next, go to Reports → Acquisition → Traffic acquisition to get your visitors for the same date range.
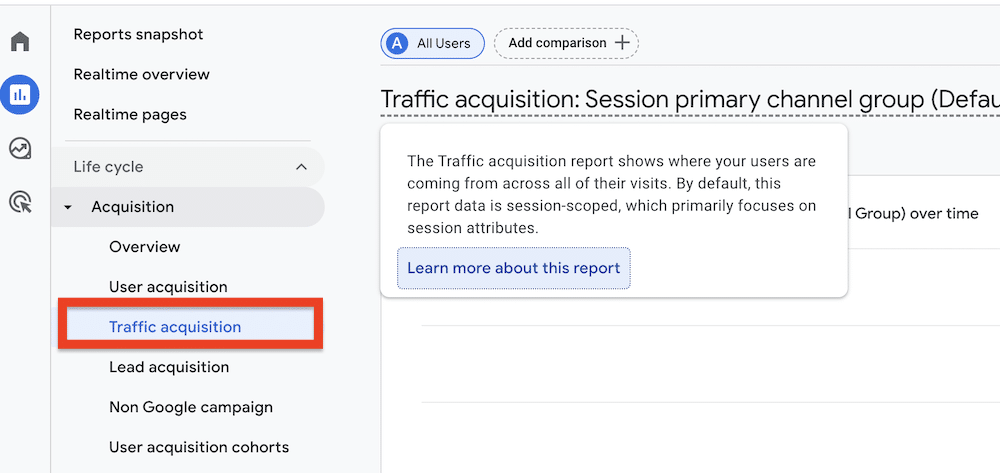
Finally, divide revenue by visitors to get revenue per visitor.
3. Average order value
Average order value shows how much each completed order is worth. It helps you understand whether customers are spending more when they buy, not just whether more people are placing orders.
This KPI is especially useful when testing bundles, upsells, cross-sells, free shipping thresholds, pricing presentation, or cart offers. In all of those cases, the goal is not only to get more orders but also to increase the value of each order.
Formula:
Average order value = total revenue ÷ total number of orders
For example, if your store made $10,000 from 200 orders, your average order value is $50.
Where to find it:
In Shopify, go to Analytics and look for Average order value on the dashboard.
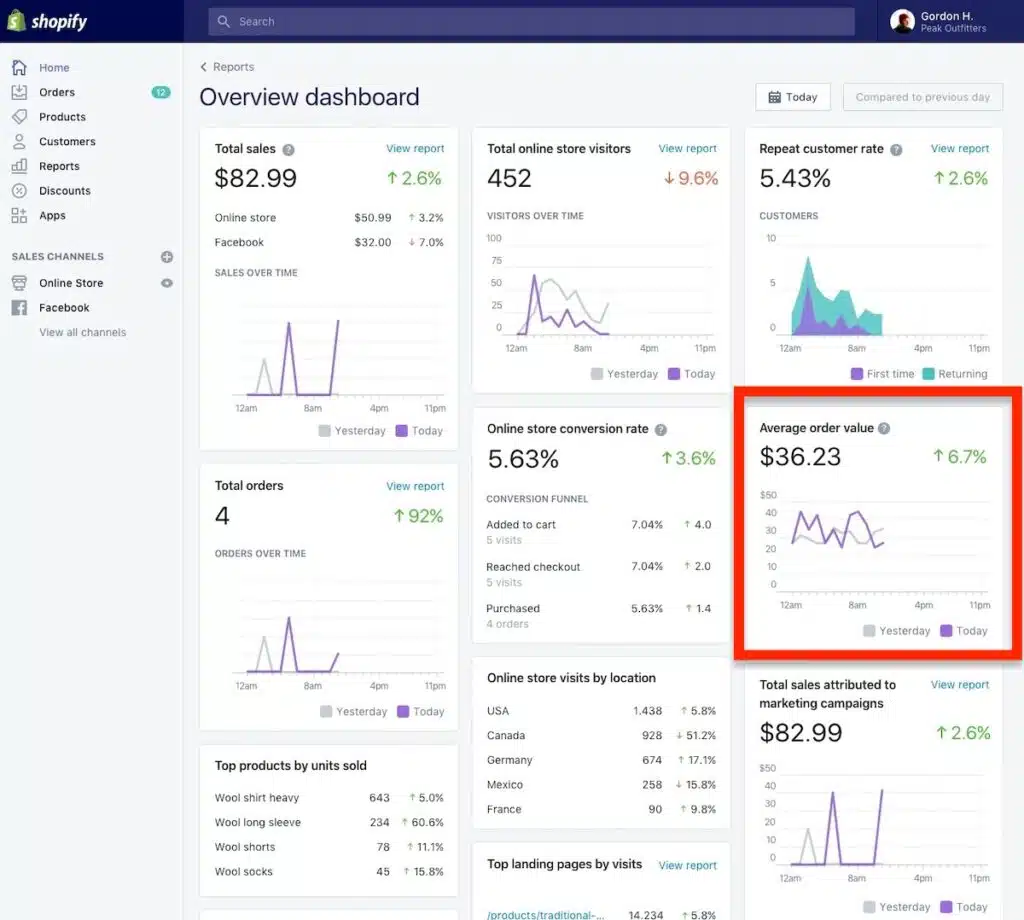
Shopify average order value metric (Source)
In GA4, you may not see this metric clearly in the default report. The easiest option is to pull purchase revenue from Reports → Monetization and divide it by the number of purchases/orders for the same date range.
4. Lead conversion rate/demo booking rate/trial signup rate
This KPI shows the percentage of visitors who take the next step you want them to take, such as submitting a lead form, booking a demo, or signing up for a trial.
For B2B, lead gen, and SaaS companies, this KPI is often more useful than purchase conversion rate because the website usually does not close the sale on the first visit. Its job is to get the visitor to take the next step, such as submitting a form, booking a demo, or starting a trial. Since revenue happens later, the purchase conversion rate is often too far removed from the page or test you are trying to evaluate.
Formula:
Lead conversion rate = leads ÷ total visitors × 100
Demo booking rate = demo bookings ÷ total visitors × 100
Trial signup rate = trial signups ÷ total visitors × 100
If 2,000 people visit your page and 80 book a demo, your demo booking rate is 4%.
Where to find it:
First, make sure GA4 is tracking the action you care about.
For example, if you want to measure form submissions or demo bookings, you need to set up that action as an event in GA4. Google explains that you need to either identify an existing event or create one, then mark it as a key event if it represents an important business action.
Once that is in place:
- Go to Reports → Engagement to check whether your form submit, demo request, or signup event is being recorded
- Go to Reports → Acquisition → Traffic acquisition to get your visitors for the same date range
- Divide conversions by visitors to get the conversion rate
If you want to see how people move through multiple steps before converting, use Explore → Funnel exploration. That is the report built for step-by-step journeys and drop-offs.
KPIs that show where people move forward or drop off in the funnel
These KPIs help you see where people drop off in the funnel. A low overall conversion rate tells you the site is underperforming. These metrics help you see whether the problem is on the product page, in the cart, in checkout, or inside the form.
1. Add-to-cart rate
Add-to-cart rate shows the percentage of product page visitors who add an item to their cart. This is one of the clearest ways to judge whether your product page is doing its job.
Formula:
Add-to-cart rate = add-to-cart actions ÷ product page visitors × 100
If 1,000 people view a product page and 80 add the item to cart, the add-to-cart rate is 8%.
Where to find it:
In GA4, find your add_to_cart event and compare it with the number of product page visitors for the same date range.
What it helps you understand:
If traffic is reaching the product page but few people add to the cart, the problem is often on the page itself. The issue may be unclear product information, weak images, missing reviews, price shock, shipping concerns, or low trust.
2. Cart-to-checkout rate
Cart-to-checkout rate shows the percentage of users who move from cart to checkout.
Formula:
Cart-to-checkout rate = checkout starts ÷ carts created × 100
If 500 users add something to cart and 250 start checkout, the cart-to-checkout rate is 50%.
Where to find it:
In GA4, compare your begin_checkout event with your cart-related event count for the same period.
What it helps you understand:
This tells you whether people who show buying intent are motivated enough to continue. If this number is weak, the friction is often in the cart: unexpected shipping costs, unclear totals, distracting coupon fields, weak trust signals, or a poor cart experience.
3. Checkout completion rate
Checkout completion rate shows the percentage of users who complete their purchase after starting checkout.
Formula:
Checkout completion rate = purchases ÷ checkout starts × 100
If 300 users start checkout and 180 complete their purchase, the checkout completion rate is 60%.
Where to find it:
In GA4, compare your purchase event with your begin_checkout event for the same date range.
What it helps you understand:
This KPI helps you isolate friction inside checkout. If lots of users start checkout but too few finish, the problem may be forced account creation, too many fields, payment issues, lack of delivery clarity, or weak trust near the final step.
4. Form completion rate
Form completion rate shows the percentage of users who submit a form after starting it.
Formula:
Form completion rate = form submissions ÷ form starts × 100
If 120 people start a form and 60 submit it, the form completion rate is 50%.
Where to find it:
In GA4, this works only if both form start and form submit are being tracked as events. Then compare submissions with starts for the same date range.
What it helps you understand:
This KPI helps you spot friction inside the form itself. If many users start but few finish, the issue is often form length, unclear fields, privacy concerns, poor mobile UX, or too much effort required.
Depending on the funnel, you may also track form start rate, landing page conversion rate, onboarding completion rate, or other step-by-step funnel metrics. But the four above are usually enough to show where people are moving forward and where they are dropping off.
KPIs that measure lead quality
Engagement metrics to use carefully
How to choose the right CRO KPI for a test or initiative
This should be a clear framework.
Start with the business goal
Examples:
- increase revenue
- increase qualified demos
- improve onboarding completion
- reduce abandonment
Pick one primary KPI
Avoid trying to “win” on everything at once. This aligns with Invesp’s own advice on focusing goals.
Add 2–4 diagnostic KPIs
So you can explain movement.
Add 1–3 guardrail KPIs
So you do not create downstream damage.
Segment where it matters
Examples:
- mobile vs desktop
- paid vs organic
- new vs returning visitors
- product category or traffic source
Invesp’s CRO strategy content already emphasizes segmentation and identifying bottlenecks before testing